Justify Missing Coverage Using MATLAB Test Manager
This example shows how to use MATLAB® Test Manager to analyze code coverage, view the code coverage report, justify missing outcomes, and explains the differences between the coverage reports for the most recent run and the run history.
Open the Project
This example uses the MATLABShortestPath project. The project includes a src folder, which contains the shortest_path function, a tests folder, which contains tests for the function, and a requirements folder, which contains Requirements Toolbox™ software requirements. The shortest_path function finds the shortest path between two nodes in a graph.
openProject("MATLABShortestPath");Open MATLAB Test Manager and Run Tests
Open the MATLAB Test Manager. In the Project tab, in the Tools menu, under Apps, click MATLAB Test Manager.
Click the Code Coverage button ![]() , select Enable MATLAB code coverage, and set the slider to MC/DC.
, select Enable MATLAB code coverage, and set the slider to MC/DC.

Click the Run tests button ![]() .
.
View Coverage Results
In the MATLAB Test Manager, the top row summarizes of the results of the tests. Fourteen tests pass, one fails, and 88% of code statements execute. To see more details, point to the Statement button in the MATLAB Test Manager summary.

Create the code coverage report by clicking the Statement button in the MATLAB Test Manager.

Justify Coverage Outcome
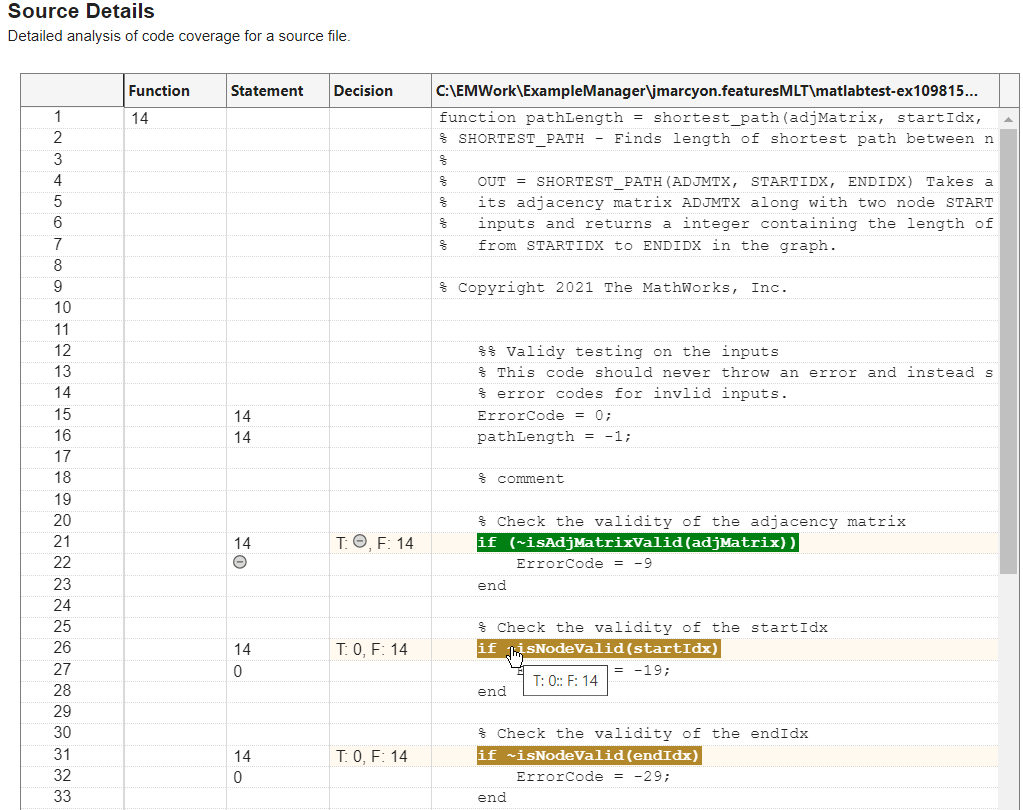
When you analyze coverage with the MC/DC metric selected, the code coverage report opens to the MC/DC results. You cannot justify code coverage outcomes in the MC/DC or condition coverage views. To justify coverage outcomes, set Currently viewing to Decision.
In the Source Details section, create a justification for line 21 by clicking the entry point for the code block if (~isAdjMatrixValid(adjMatrix)). In the Create Coverage Justification dialog box, enter a reason for the justification. For this example, enter Defensive coding and click OK.

In the MATLAB Test Manager, point to the Statement button to see the updated coverage information. Decision coverage increases from 80.6% to 83.3%, and the statement coverage increases from 88% to 90%.
Archive Justifications into Run History
In the MATLAB Test Manager, click the Run tests button ![]() . When you re-run a test, the run history records information on the applied coverage filters. Because coverage reports that you create from the run history are read only you cannot add or remove justification filters to those reports.
. When you re-run a test, the run history records information on the applied coverage filters. Because coverage reports that you create from the run history are read only you cannot add or remove justification filters to those reports.
In the MATLAB Test Manager, in the menu, click the drop down menu on the left and select your first run, which is the last option under Previous runs. The first run shows the statement coverage results before you created the justification, which was 88%. Then, select the more recent run under the Previous runs to see the updated value of 90%.
Click the Statement button from this run, set Currently viewing to Decision, and scroll to Source Details. Row 21 displays the code coverage justification that you created in that run, and row 26 shows missing coverage that you cannot justify in this read only report.

Create Coverage Report from Code Quality Dashboard
Open the Code Quality Dashboard.
codeQualityDashboard;

In the yellow banner, click Refresh Metrics. Open the code coverage report by clicking the MATLAB Code Coverage section title or clicking the three dot menu ![]() and selecting Open Report. Coverage reports that you create from the Code Quality Dashboard open with the most recent results, apply coverage justifications that you created, and are writable, so you can add or remove coverage justifications.
and selecting Open Report. Coverage reports that you create from the Code Quality Dashboard open with the most recent results, apply coverage justifications that you created, and are writable, so you can add or remove coverage justifications.
See Also
Functions
Classes
matlab.unittest.plugins.CodeCoveragePlugin|matlab.coverage.Result|matlabtest.coverage.Justification