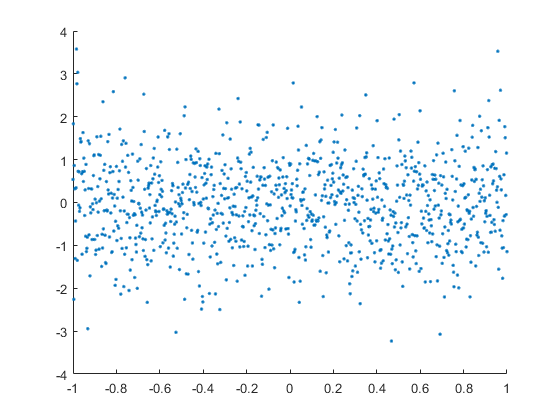
regionZoomInteraction
Region-zoom interaction
Description
A region-zoom interaction allows you to zoom into a rectangular region of a chart
in a 2-D view without having to select any buttons in the axes toolbar. To enable region
zooming, set the Interactions property of the axes to a
regionZoomInteraction object. When this interaction is enabled, you can
zoom into a region by dragging within the chart.
To enable multiple interactions, set the Interactions property to an
array of objects.
Creation
Description
rz = regionZoomInteraction creates a region-zoom interaction
object.
rz = regionZoomInteraction('Dimensions',d) sets the Dimensions property.
Use this property to constrain zooming to specific dimensions. For example, rz =
regionZoomInteraction('Dimensions','x') constrains zooming to the
x-dimension.
Properties
Examples
Limitations
The region-zoom interaction is not supported for charts in a 3-D view.
Tips
In most cases, the axes have a default set of interactions which depend on the type of chart you are displaying. You can replace the default set with a new set of interactions, but you cannot access or modify any of the interactions in the default set.
Version History
Introduced in R2019a

