stairs
Gráfica de escalones

Sintaxis
Descripción
Datos de vectores y matrices
stairs( dibuja una gráfica de escalones de los elementos de Y)Y.
Si
Yes un vector,stairsdibuja una línea.Si
Yes una matriz,stairsdibuja una línea por cada columna de la matriz.
Datos de tabla
stairs( representa la variable especificada desde la tabla con respecto a los índices de fila de la tabla. Si la tabla es un horario, la variable especificada se representa con respecto a los tiempos de fila del horario. Para representar un conjunto de valores y, especifique una variable para tbl,yvar)yvar. Para representar múltiples conjuntos de valores y, especifique múltiples variables para yvar. (desde R2022b)
Otras opciones
stairs(___, modifica la gráfica de escalones utilizando uno o más argumentos de par nombre-valor. Por ejemplo, Name,Value)"Marker","o","MarkerSize",8 especifica marcadores circulares de 8 puntos.
stairs( representa en los ejes especificados por ax,___)ax en lugar de en los ejes actuales (gca). La opción ax puede preceder a cualquiera de las combinaciones de argumentos de entrada de las sintaxis anteriores.
h = stairs(___)Stair. Utilice h para hacer cambios en las propiedades de un objeto Stair específico después de crearlo.
Ejemplos
Cree una gráfica de escalones de seno evaluado en 40 valores equidistantes entre 0 y .
X = linspace(0,4*pi,40);
Y = sin(X);

figure
stairs(Y)
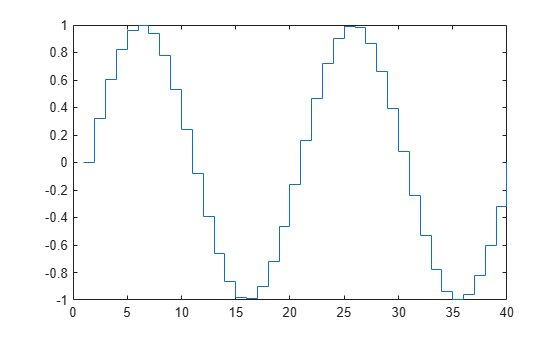
La longitud de Y determina automáticamente y genera la escala del eje x.
Cree una gráfica de escalones de dos funciones de coseno evaluadas en 50 valores equidistantes entre 0 y .
X = linspace(0,4*pi,50)';
Y = [0.5*cos(X), 2*cos(X)];

figure
stairs(Y)
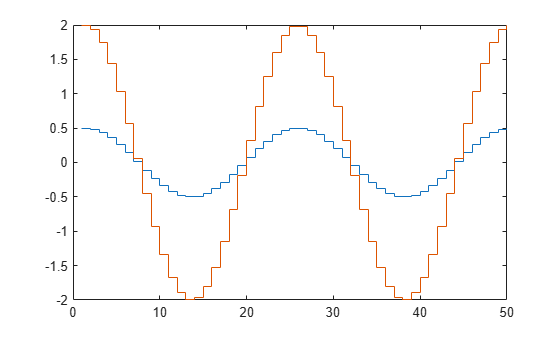
El número de filas en Y determina automáticamente y genera la escala del eje x.
Cree una gráfica de escalones de una onda sinusoidal evaluada en valores equidistantes entre 0 y . Especifique el conjunto de valores x para la gráfica.
X = linspace(0,4*pi,40);
Y = sin(X);

figure
stairs(X,Y)
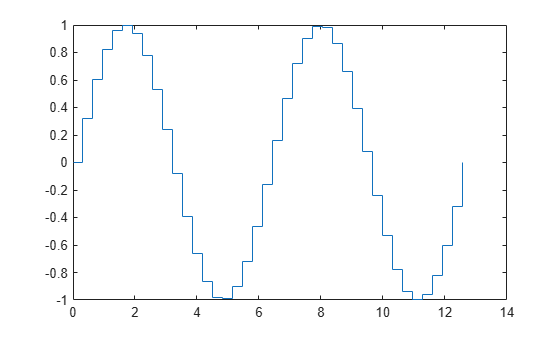
Las entradas de Y se representan con respecto a las entradas correspondientes de X.
Cree una gráfica de escalones de dos ondas de coseno evaluadas en valores equidistantes entre 0 y . Especifique el conjunto de valores x para la gráfica.
X = linspace(0,4*pi,50)';
Y = [0.5*cos(X), 2*cos(X)];

figure
stairs(X,Y)
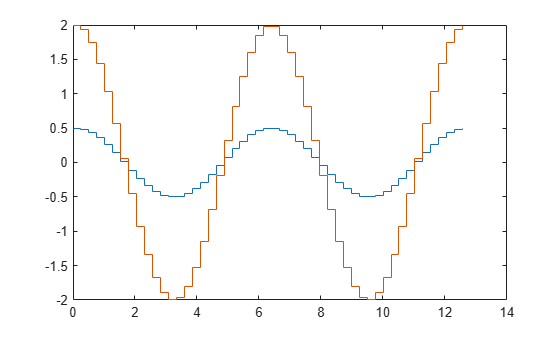
La primera entrada de vector, X, determina las posiciones del eje x para ambas series de datos.
Cree una gráfica de escalones de dos ondas sinusoidales evaluadas en valores diferentes. Especifique un conjunto único de valores x para representar cada serie de datos.
x1 = linspace(0,2*pi)';
x2 = linspace(0,pi)';
X = [x1,x2];
Y = [sin(5*x1),exp(x2).*sin(5*x2)];

figure
stairs(X,Y)
Cada columna de X se representa con respecto a la columna correspondiente de Y.
Cree una gráfica de escalones y establezca el estilo de línea en una línea discontinua, el símbolo de marcador en círculos y el color en rojo.
X = linspace(0,4*pi,20);
Y = sin(X);

figure
stairs(Y, '-.or')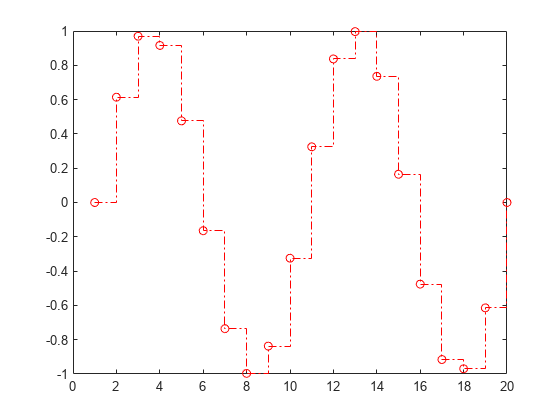
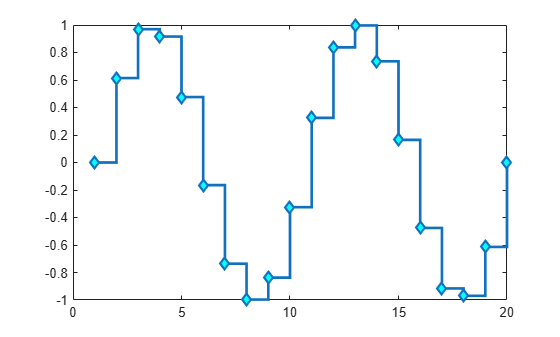
Cree una gráfica de escalones y establezca la anchura de línea en 2, los símbolos de marcador en diamantes y el color de la cara del marcador en cian usando argumentos de par Name,Value.
X = linspace(0,4*pi,20);
Y = sin(X);

figure
stairs(Y,'LineWidth',2,'Marker','d','MarkerFaceColor','c')
Desde R2022b
Una forma práctica de representar datos desde una tabla es pasar la tabla a la función stairs y especificar las variables que se desea representar.
Lea las primeras 100 filas y 7 columnas de weather.csv como horario tbl. Después, muestre las primeras tres filas de la tabla.
tbl = readtimetable("weather.csv","Range",[1 1 101 7]);
head(tbl,3)
            Time            WindDirection    WindSpeed    Humidity    Temperature    RainInchesPerMinute    CumulativeRainfall
    ____________________    _____________    _________    ________    ___________    ___________________    __________________

    25-Oct-2021 00:00:09         46               1          84          49.2                 0                     0
    25-Oct-2021 00:01:09         45             1.6          84          49.2                 0                     0
    25-Oct-2021 00:02:09         36             2.2          84          49.2                 0                     0
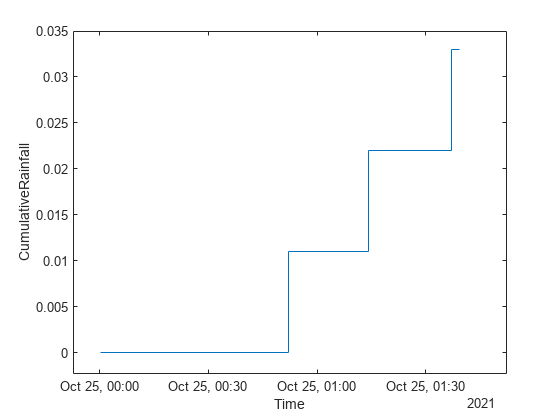
Represente la variable Time en el eje x y la variable CumulativeRainfall en el eje y. Después, utilice el comando axis padded para que la línea y el cuadro de la gráfica no se solapen.
Devuelva el objeto Stair como h. Observe que las etiquetas de los ejes coinciden con los nombres de las variables.
h = stairs(tbl,"Time","CumulativeRainfall");
axis padded
Modifique el color de la línea a morado configurando la propiedad Color.
h.Color = [0.5 0 0.8];

Desde R2022b
Cree los vectores x, y1 e y2 y utilícelos para crear una tabla. Represente las variables y1 e y2 con respecto a la variable x. Utilice el comando axis padded para que la línea y el cuadro de la gráfica no se solapen.
Añada una leyenda y observe que las etiquetas de las leyendas coinciden con los nombres de las variables.
x = linspace(0,6,20);
y1 = cos(x);
y2 = sin(x);
tbl = table(x,y1,y2);
stairs(tbl,"x",["y1","y2"]);

% Pad x- and y-axes, and add legend
axis padded
legend

También puede omitir la variable x y representar las variables y1 e y2 con respecto a los índices de fila de la tabla.
stairs(tbl,["y1","y2"]);
axis padded
legend

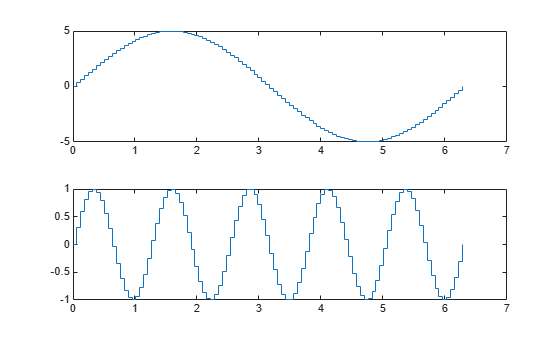
Puede mostrar un mosaico de gráficas utilizando las funciones tiledlayout y nexttile. Llame a la función tiledlayout para crear un diseño de gráfica en mosaico de 2 por 1. Llame a la función nexttile para crear los objetos de ejes ax1 y ax2. Cree gráficas separadas de escalones en los ejes especificando el objeto de ejes como primer argumento en stairs.
x = linspace(0,2*pi);
y1 = 5*sin(x);
y2 = sin(5*x);
tiledlayout(2,1)

% Top plot
ax1 = nexttile;
stairs(ax1,x,y1)

% Bottom plot
ax2 = nexttile;
stairs(ax2,x,y2)
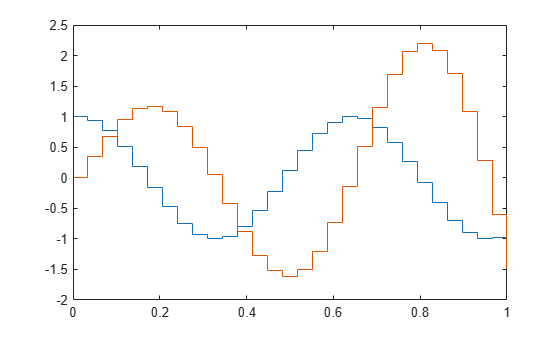
Cree una gráfica de escalones de dos series de datos y devuelva los dos objetos stair.
X = linspace(0,1,30)';
Y = [cos(10*X), exp(X).*sin(10*X)];
h = stairs(X,Y);
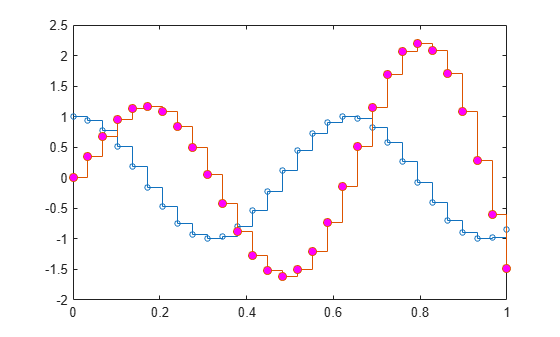
Utilice marcadores circulares pequeños para la primera serie de datos. Utilice círculos magenta rellenos para la segunda serie. Utilice la notación de puntos para establecer las propiedades.
h(1).Marker = 'o';
h(1).MarkerSize = 4;
h(2).Marker = 'o';
h(2).MarkerFaceColor = 'm';
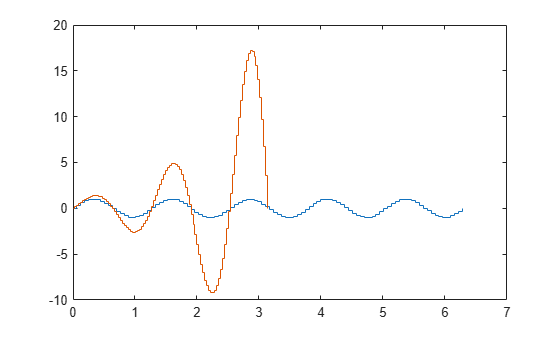
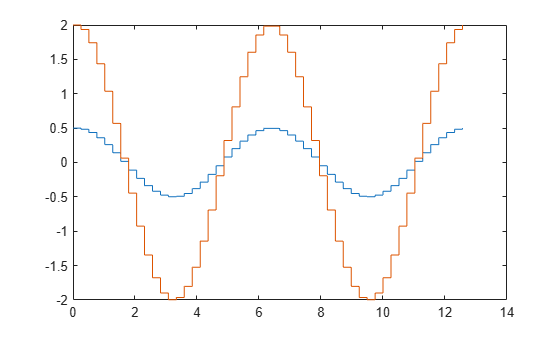
Evalúe dos funciones de coseno en 50 valores equidistantes entre 0 y y cree una gráfica de escalones con plot.
X = linspace(0,4*pi,50)';
Y = [0.5*cos(X), 2*cos(X)];
[xb,yb] = stairs(X,Y);
stairs devuelve dos matrices del mismo tamaño, xb e yb, pero ninguna gráfica.
Utilice plot para crear la gráfica de escalones con xb e yb.
figure
plot(xb,yb)
Argumentos de entrada
valores y, especificados como vector o matriz. Cuando Y es un vector, stairs crea un objeto stair. Cuando Y es una matriz, stairs dibuja una línea por cada columna de la matriz y crea un objeto stair separado para cada columna.
Tipos de datos: single | double | int8 | int16 | int32 | int64 | uint8 | uint16 | uint32 | uint64 | categorical | datetime | duration
valores x, especificados como vector o matriz. Cuando Y es un vector, X debe ser un vector del mismo tamaño. Cuando Y es una matriz, X debe ser una matriz del mismo tamaño, o un vector cuya longitud sea igual al número de filas en Y.
Tipos de datos: single | double | int8 | int16 | int32 | int64 | uint8 | uint16 | uint32 | uint64 | categorical | datetime | duration
Estilo de línea, marcador y color, especificados como un escalar de cadena o un vector de caracteres que contiene símbolos. Los símbolos pueden aparecer en cualquier orden. No es necesario especificar las tres características (estilo de línea, marcador y color). Por ejemplo, si se omite el estilo de línea y se especifica el marcador, la gráfica muestra solo el marcador y ninguna línea.
Ejemplo: "--or" es una línea discontinua roja con marcadores circulares.
| Estilo de línea | Descripción | Línea resultante |
|---|---|---|
"-" | Línea continua |
|
"--" | Línea discontinua |
|
":" | Línea de puntos |
|
"-." | Línea de puntos y rayas |
|


| Marcador | Descripción | Marcador resultante |
|---|---|---|
"o" | Círculo |
|
"+" | Signo más |
|
"*" | Asterisco |
|
"." | Punto |
|
"x" | Cruz |
|
"_" | Línea horizontal |
|
"|" | Línea vertical |
|
"square" | Cuadrado |
|
"diamond" | Rombo |
|
"^" | Triángulo hacia arriba |
|
"v" | Triángulo hacia abajo |
|
">" | Triángulo hacia la derecha |
|
"<" | Triángulo hacia la izquierda |
|
"pentagram" | Pentagrama |
|
"hexagram" | Hexagrama |
|


| Nombre del color | Nombre corto | Triplete RGB | Apariencia |
|---|---|---|---|
"red" | "r" | [1 0 0] |
|
"green" | "g" | [0 1 0] |
|
"blue" | "b" | [0 0 1] |
|
"cyan" | "c" | [0 1 1] |
|
"magenta" | "m" | [1 0 1] |
|
"yellow" | "y" | [1 1 0] |
|
"black" | "k" | [0 0 0] |
|
"white" | "w" | [1 1 1] |
|


Tabla de origen que contiene los datos que se desea representar, especificada como tabla u horario.
Variables de tabla que contienen las coordenadas y, especificadas utilizando uno de los esquemas de indexación de la tabla.
| Esquema de indexación | Ejemplos |
|---|---|
Nombres de variables:
|
|
Índices de variables:
|
|
Tipo de variable:
|
|
Las variables de tabla que especifique pueden contener valores numéricos, categóricos, de fecha/hora y de duración. Si xvar e yvar especifican múltiples variables, el número de variables debe ser el mismo.
Ejemplo: stairs(tbl,"x",["y1","y2"]) especifica las variables de tabla llamadas y1 e y2 para las coordenadas y.
Ejemplo: stairs(tbl,"x",2) especifica la segunda variable para las coordenadas y.
Ejemplo: stairs(tbl,"x",vartype("numeric")) especifica todas las variables numéricas para las coordenadas y.
Variables de tabla que contienen las coordenadas x, especificadas utilizando uno de los esquemas de indexación de la tabla.
| Esquema de indexación | Ejemplos |
|---|---|
Nombres de variables:
|
|
Índices de variables:
|
|
Tipo de variable:
|
|
Las variables de tabla que especifique pueden contener valores numéricos, categóricos, de fecha/hora y de duración. Si xvar e yvar especifican múltiples variables, el número de variables debe ser el mismo.
Ejemplo: stairs(tbl,["x1","x2"],"y") especifica las variables de tabla llamadas x1 y x2 para las coordenadas x.
Ejemplo: stairs(tbl,2,"y") especifica la segunda variable para las coordenadas x.
Ejemplo: stairs(tbl,vartype("numeric"),"y") especifica todas las variables numéricas para las coordenadas x.
Objeto Axes. Si no especifica los ejes, stairs representa en los ejes actuales.
Argumentos de par nombre-valor
Especifique pares opcionales de argumentos como Name1=Value1,...,NameN=ValueN, donde Name es el nombre del argumento y Value es el valor correspondiente. Los argumentos nombre-valor deben aparecer después de otros argumentos, pero el orden de los pares no importa.
En las versiones anteriores a R2021a, utilice comas para separar cada nombre y valor, y encierre Name entre comillas.
Ejemplo: "Marker","s","MarkerFaceColor","red" representa la gráfica de escalones con marcadores cuadrados rojos.
Las propiedades que se enumeran aquí son solo un subconjunto. Para obtener una lista completa, consulte Stair Properties.
Estilo de línea, especificado como una de las opciones enumeradas en esta tabla.
| Estilo de línea | Descripción | Línea resultante |
|---|---|---|
"-" | Línea continua |
|
"--" | Línea discontinua |
|
":" | Línea de puntos |
|
"-." | Línea de puntos y rayas |
|
"none" | Sin línea | Sin línea |
Color de línea, especificado como triplete RGB, código de color hexadecimal, nombre de color o nombre corto.
Para definir un color personalizado, especifique un triplete RGB o un código de color hexadecimal.
Un triplete RGB es un vector fila de tres elementos, cuyos elementos especifican las intensidades de los componentes rojo, verde y azul del color. Las intensidades deben estar en el rango
[0,1], por ejemplo[0.4 0.6 0.7].Un código de color hexadecimal es un escalar de cadena o un vector de caracteres que comienza con el símbolo de almohadilla (
#) seguido de tres o seis dígitos hexadecimales, que pueden oscilar entre0yF. Los valores no distinguen entre mayúsculas y minúsculas. Por lo tanto, los códigos de color"#FF8800","#ff8800","#F80"y"#f80"son equivalentes.
Como alternativa, puede especificar algunos colores frecuentes por su nombre. En esta tabla, se enumeran las opciones de color con su nombre, los tripletes RGB equivalentes y los códigos de color hexadecimales.
| Nombre del color | Nombre corto | Triplete RGB | Código de color hexadecimal | Apariencia |
|---|---|---|---|---|
"red" | "r" | [1 0 0] | "#FF0000" |
|
"green" | "g" | [0 1 0] | "#00FF00" |
|
"blue" | "b" | [0 0 1] | "#0000FF" |
|
"cyan" | "c" | [0 1 1] | "#00FFFF" |
|
"magenta" | "m" | [1 0 1] | "#FF00FF" |
|
"yellow" | "y" | [1 1 0] | "#FFFF00" |
|
"black" | "k" | [0 0 0] | "#000000" |
|
"white" | "w" | [1 1 1] | "#FFFFFF" |
|
"none" | No se aplica | No se aplica | No se aplica | Sin color |
En esta tabla, se enumeran las paletas de colores predeterminados para las gráficas en los temas claro y oscuro.
| Paleta | Colores de la paleta |
|---|---|
Antes de R2025a: La mayoría de las gráficas utilizan estos colores de forma predeterminada. |
|
|
|


Puede obtener los tripletes RGB y los códigos de color hexadecimales de estas paletas usando las funciones orderedcolors y rgb2hex. Por ejemplo, puede obtener los tripletes RGB de la paleta "gem" y convertirlos en códigos de color hexadecimales.
RGB = orderedcolors("gem");
H = rgb2hex(RGB);
Antes de R2023b: Obtenga los tripletes RGB usando RGB = get(groot,"FactoryAxesColorOrder").
Antes de R2024a: Obtenga los códigos de color hexadecimales usando H = compose("#%02X%02X%02X",round(RGB*255)).
Ejemplo: "blue"
Ejemplo: [0 0 1]
Ejemplo: "#0000FF"
Símbolo de marcador, especificado como uno de los valores enumerados en esta tabla. De forma predeterminada, el objeto no muestra marcadores. La especificación de un símbolo de marcador agrega marcadores en todos los puntos de datos o vértices.
| Marcador | Descripción | Marcador resultante |
|---|---|---|
"o" | Círculo |
|
"+" | Signo más |
|
"*" | Asterisco |
|
"." | Punto |
|
"x" | Cruz |
|
"_" | Línea horizontal |
|
"|" | Línea vertical |
|
"square" | Cuadrado |
|
"diamond" | Rombo |
|
"^" | Triángulo hacia arriba |
|
"v" | Triángulo hacia abajo |
|
">" | Triángulo hacia la derecha |
|
"<" | Triángulo hacia la izquierda |
|
"pentagram" | Pentagrama |
|
"hexagram" | Hexagrama |
|
"none" | Sin marcadores | No se aplica |
Como alternativa, puede especificar algunos colores frecuentes por su nombre. En esta tabla, se enumeran las opciones de color con su nombre, los tripletes RGB equivalentes y los códigos de color hexadecimales.
| Nombre del color | Nombre corto | Triplete RGB | Código de color hexadecimal | Apariencia |
|---|---|---|---|---|
"red" | "r" | [1 0 0] | "#FF0000" |
|
"green" | "g" | [0 1 0] | "#00FF00" |
|
"blue" | "b" | [0 0 1] | "#0000FF" |
|
"cyan" | "c" | [0 1 1] | "#00FFFF" |
|
"magenta" | "m" | [1 0 1] | "#FF00FF" |
|
"yellow" | "y" | [1 1 0] | "#FFFF00" |
|
"black" | "k" | [0 0 0] | "#000000" |
|
"white" | "w" | [1 1 1] | "#FFFFFF" |
|
"none" | No se aplica | No se aplica | No se aplica | Sin color |
En esta tabla, se enumeran las paletas de colores predeterminados para las gráficas en los temas claro y oscuro.
| Paleta | Colores de la paleta |
|---|---|
Antes de R2025a: La mayoría de las gráficas utilizan estos colores de forma predeterminada. |
|
|
|
Puede obtener los tripletes RGB y los códigos de color hexadecimales de estas paletas usando las funciones orderedcolors y rgb2hex. Por ejemplo, puede obtener los tripletes RGB de la paleta "gem" y convertirlos en códigos de color hexadecimales.
RGB = orderedcolors("gem");
H = rgb2hex(RGB);
Antes de R2023b: Obtenga los tripletes RGB usando RGB = get(groot,"FactoryAxesColorOrder").
Antes de R2024a: Obtenga los códigos de color hexadecimales usando H = compose("#%02X%02X%02X",round(RGB*255)).