validatecolor
Validate color values
Description
RGB = validatecolor(colors)validatecolor returns the equivalent RGB triplet for the color. One
of the criteria validatecolor checks is whether one or multiple colors
are specified. For this syntax, specifying more than one color is invalid, and produces an
error.
Examples
Validate an unsigned 8-bit color value.
RGB = validatecolor(uint8([128 0 255]))
RGB = 1×3

    0.5020         0    1.0000
Create a 2-by-3 matrix containing the unsigned 16-bit values for two colors. Then validate the colors.
c = uint16([32768 0 65535; 0 65535 0]);
RGB = validatecolor(c,'multiple')
RGB = 2×3
0.5000 0 1.0000
0 1.0000 0
Validate three color names.
RGB = validatecolor({'red','green','blue'},'multiple')RGB = 3×3
1 0 0
0 1 0
0 0 1
Validate three hexadecimal color codes.
RGB = validatecolor({'#8000FF','#0F0','#FF9900'},'multiple')RGB = 3×3
0.5020 0 1.0000
0 1.0000 0
1.0000 0.6000 0
Define a function called plotlines that accepts
y as an array of y-coordinates and
linecolors as the colors for the lines. The function creates a
colored line plot of the values in y.
Within the function, check the validity of linecolors by calling
the validatecolor function. Specify the
'multiple' option to allow users to specify one or more colors. If
the colors are invalid, validatecolor displays an error message.
Otherwise, it returns the equivalent RGB triplet array. Next, use the size of the
RGB array to determine the distribution of the colors among the
lines.
Save the function as plotlines.m in a writable folder.
function plotlines(y,linecolors)
% Plot colored lines.
p = plot(y);

% Check for valid color values
RGB = validatecolor(linecolors,'multiple');

% Use RGB array in a calculation
ncolors = size(RGB,1);
nlines = numel(p);
nupdate = min(ncolors,nlines);
for n = 1:nupdate
    p(n).Color = RGB(n,:);
end
Call the plotlines function to plot a red, a blue, and a black
line.
plotlines([0 1 2; 1 2 3],{'red','blue','black'})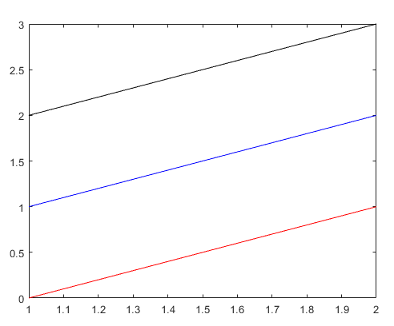
Now call the function with an invalid color value. In this case, specify a scalar
value instead of an m-by-3 array. MATLAB® displays the error returned by the validatecolor
function.
plotlines([0 1 2; 1 2 3],255)
Error using validatecolor (line 50)
Specify colors as a three-column matrix.

Error in plotlines (line 6)
RGB = validatecolor(linecolors,'multiple');Define a function called plotminmax that accepts
y as an array of y-coordinates and
c as an optional color argument. The function creates a line plot
with dashed horizontal lines at the minimum and maximum values of y.
The dashed lines are black by default, but the user can customize the color with the
c argument.
Within the arguments block, check the validity of
c with the validatecolor function. Define
'black' as the default color so that c can be an
optional input. Then, plot y, and display horizontal lines at the
minimum and maximum values using the color c.
Save the function as plotminmax.m in a writable folder.
function plotminmax(y,c)
% Plot lines with horizontal lines indicating min/max of y.
arguments
    y {mustBeNumeric, mustBeNonempty}
    c {validatecolor} = 'black'
end

plot(y)

% Add min and max lines
ymin = min(y,[],'all');
ymax = max(y, [],'all');
yline(ymin,'--','Color',c)
yline(ymax,'--','Color',c)
end
Call the plotminmax function with the hexadecimal color code for
red. The function plots the coordinates and displays the horizontal lines with the
specified color.
plotminmax([8.4 2.5 7 3 9.2],'#FF0000')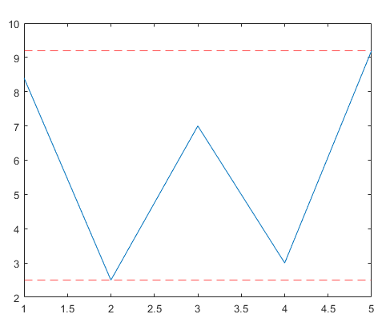
Call the function with an invalid color value. In this case, specify an invalid
color name. MATLAB displays the error returned by the validatecolor
function.
plotminmax([8.4 2.5 7 3 9.2],'chartreuse')Error using plotminmax
Invalid argument at position 2. 'chartreuse' is not a valid
color specification. Valid names include: 'red', 'green',
'blue', 'cyan', 'magenta', 'yellow', 'black', and 'white'.
Valid hexadecimal color codes consist of '#' followed by three
or six hexadecimal digits.Input Arguments
Color values to validate, specified as one of the following:
1-by-3 vector of
singleordoublevalues in the range[0,1], where the values correspond to the intensities of the red, green, and blue components of color, respectively.1-by-3 vector of unsigned integers, where the integers correspond to the intensities of the red, green, and blue components of color, respectively.
m-by-3 matrix of
singleordoublevalues, or unsigned integers, where each row in the matrix contains the intensities of the red, green, and blue components of a color.Character vector that specifies a color name such as
'red', or a hexadecimal color code such as'#F92B30'.1-D cell array of character vectors or a string array, where each element in the array is either a color name such as
'red', or a hexadecimal color code such as'#F92B30'.
The following table lists the valid color names with the equivalent RGB triplets and hexadecimal color codes.
| Color Name | Short Name | RGB Triplet | Hexadecimal Color Code | Appearance |
|---|---|---|---|---|
"red" | "r" | [1 0 0] | "#FF0000" |
|
"green" | "g" | [0 1 0] | "#00FF00" |
|
"blue" | "b" | [0 0 1] | "#0000FF" |
|
"cyan"
| "c" | [0 1 1] | "#00FFFF" |
|
"magenta" | "m" | [1 0 1] | "#FF00FF" |
|
"yellow" | "y" | [1 1 0] | "#FFFF00" |
|
"black" | "k" | [0 0 0] | "#000000" |
|
"white" | "w" | [1 1 1] | "#FFFFFF" |
|
Example: RGB = validatecolor(uint8([255 0 0]))
Example: RGB = validatecolor("#FF8800")
Data Types: single | double | int8 | int16 | int32 | int64 | uint8 | uint16 | uint32 | uint64 | char | string
Size option, specified as one of the following options:
'one'— Accept one color value only. Return an error otherwise.'multiple'— Accept zero or more color values.
Example: RGB = validatecolor(["red"
"green"],'multiple')
Output Arguments
Version History
Introduced in R2020b