Empirical Modeling Overview
R2026bUse the Fit Models tool in the Model-Based Calibration Toolbox™ to generate empirical models for optimization and lookup table generation. After cleaning the data, select a model based on your experimental design and the structure of the available data. Identify controllable inputs, the responses to model, and the appropriate statistical model type.
By default, the toolbox uses Gaussian process models (GPM) because they typically provide good model fits with minimal tuning across a wide variety of applications. Assess model quality using statistical methods and visualization techniques. For more information, see Empirical Modeling.
After selecting a suitable model that meets the accuracy and generalization checks, proceed to Lookup Table Optimization Overview for information on how to run the optimization and generate lookup table values.
Fit Model
Use the Fit Models tool in the Model Browser window to open the wizard for configuring data, model type, inputs, and responses. Choose the template used to create the design of experiment or import a saved template.
The table lists steps that are common to all templates.
| Task | Description | More Info |
|---|---|---|
| Select data | Select or import the data set. Optionally, specify a validation data set. | Select Data for Modeling Using the Fit Models Wizard |
| Define responses | Specify the outputs to model. | Available global model classes include: Global Model Class: Radial Basis Function |
| Select model type | Choose a statistical model. The default is a Gaussian process model (GPM), a nonparametric regression model that generally produces a good fit without extensive tuning for one-stage designs. | |
| Set boundary model | Define the supported input region. The default convex hull boundary prevents extrapolation and constrains optimization and calibration to feasible operating regions. | |
| Define inputs | Edit signal symbols, minimum and maximum values, and apply transformations as needed. |
Assess Model Fit
Assess model quality by combining engineering judgment with statistical evaluation. Statistical measures such as root mean squared error (RMSE), residual behavior, and validation error quantify how well the model reproduces the data, while engineering insight helps determine whether the observed errors are acceptable and physically meaningful.
Use the MBC Model Fitting app visualizations to evaluate model behavior relative to the data. Response plots reveal high‑level view trends and potential mismatches, while residual plots help identify systematic error patterns related to operating regions, system behavior, or measurement limitations. Together, these diagnostics support conclusions about model accuracy and generalization. For more information, see Assess High-Level Model Trends.
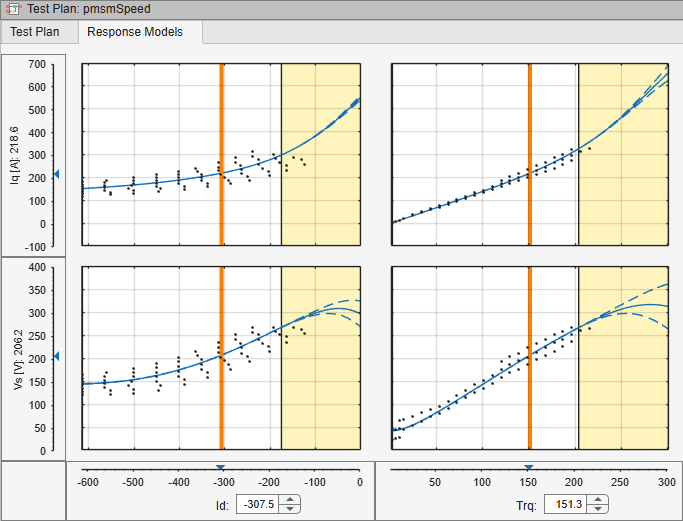
You can use the Response Models tab in the MBC Model Browser to compare model-predicted values with the corresponding measured data points for all modeled responses. Move the cursor to inspect values displayed on the axes. You can also display boundary constraints (yellow) and confidence level (%) as dashed blue lines to help assess how well the model fits the measured data.
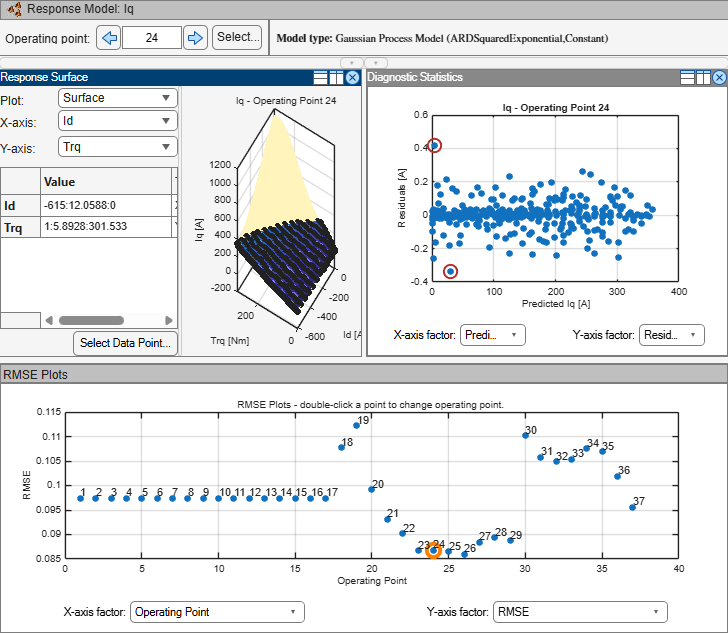
Select a specific model to look at additional details, such as response surfaces, residuals, and RMSE plots. Response surfaces help assess overall trends and determine whether the model behaves sensibly between measured points. Use residual plots to check whether values are centered around zero, which indicates a good fit. You can improve model quality by removing outliers or by fitting and comparing alternative models. Use the RMSE plot to quickly identify problem operating points. See Using the RMSE Plot with Local Models and Guidelines for Selecting the Best Model Fit.
Create Alternative Models
Fit alternative models to compare their performance and select an appropriate representation of the system. Create alternative models when data quality, residual behavior, model complexity, or application requirements make it unclear whether a single model structure adequately captures system behavior.
Compare candidate models using the plots and statistical metrics provided by the app to evaluate fit quality and robustness. Evaluating multiple models can help you to identify a solution that both represents the experimental data and generalizes to new operating conditions, which supports reliable optimization and lookup table generation. See Create Alternative Models to Compare.

