sliceViewer
Description
Medical Imaging Toolbox™ extends the functionality of the sliceViewer (Image Processing Toolbox™) object to display the slices of a medicalVolume object in the
patient coordinate system. The function uses the medicalVolume properties to
orient slices, set the intensity display range, and scale anisotropic voxels. If you do not
have Medical Imaging Toolbox installed, see sliceViewer
(Image Processing Toolbox).
When it opens a figure, the sliceViewer object displays the middle image
in the stack. The viewer displays slices along the primary direction of the volume, specified
by the Orientation property of the medicalVolume object.
Use the slider to navigate through the volume and view individual slices.

The sliceViewer object supports properties, object functions, and events
that you can use to customize its appearance and behavior. The sliceViewer
object can send notifications when certain events occur, such as the slider moving. For more
information, see Events.
Note
By default, clicking and dragging the mouse in any slice view changes the brightness and
contrast, a technique called window/level. Drag the mouse left and
right to change the contrast. Drag the mouse up and down to change the brightness. Hold
Ctrl while you click and drag to accelerate changes. Hold
Shift while you click and drag to slow the rate of change. To control
this behavior, use the DisplayRangeInteraction property.
Creation
Syntax
Description
Medical Volume Object
sliceViewer(
orients the medical volume according to the display convention
medVol,AnatomicalConvention=convention)convention.
Numeric Array
sliceViewer( displays the grayscale or
RGB volume V)V, where V is a numeric array. Use
this syntax to display image file formats not supported by medicalVolume.
Additional Options
sliceViewer(___,
sets properties using one or more
name-value arguments, in addition to any combination of input arguments from previous
syntaxes. For example, PropertyName=Value)sliceViewer(medVol,Colormap=cmap) specifies
the colormap used to display the volume.
sv = sliceViewer(___)sliceViewer object, sv. Use
sv to access and modify properties that control the visualization
of the slice images.
Input Arguments
Properties
Object Functions
addlistener | Create event listener bound to event source |
getAxesHandle | Get handle to axes in slice viewer |
Examples
Run this code to download a data set from the MathWorks® website and unzip the downloaded folder. The data set contains three CT volumes that are each saved as a directory of DICOM files. The size of the entire data set is approximately 81 MB.
zipFile = matlab.internal.examples.downloadSupportFile("medical","MedicalVolumeDICOMData.zip");
filepath = fileparts(zipFile);
unzip(zipFile,filepath)
The folder dataFolder contains the downloaded scan used by this example, LungCT01.
dataFolder = fullfile(filepath,"MedicalVolumeDICOMData","LungCT01");
Create a medical image volume object that contains the image data and spatial referencing information for the CT volume. The Orientation property indicates that the primary slice direction is "transverse".
medVol = medicalVolume(dataFolder)
medVol =
  medicalVolume with properties:

                 Voxels: [512×512×88 int16]
         VolumeGeometry: [1×1 medicalref3d]
           SpatialUnits: "mm"
            Orientation: "transverse"
           VoxelSpacing: [0.7285 0.7285 2.5000]
           NormalVector: [0 0 1]
       NumCoronalSlices: 512
      NumSagittalSlices: 512
    NumTransverseSlices: 88
           PlaneMapping: ["sagittal"    "coronal"    "transverse"]
               Modality: "CT"
          WindowCenters: [88×1 double]
           WindowWidths: [88×1 double]
View the transverse slices of the volume in the slice viewer. By default, the viewer uses the properties of medVol to scale anisotropic voxels, set the intensity display range, and orient slices. The viewer opens on the center slice. Use the scroll bar to navigate to other slices.
sv = sliceViewer(medVol,Parent=figure)
sv =
  sliceViewer with properties:

             SliceDirection: [0 0 1]
                SliceNumber: 45
                     Parent: [1×1 Panel]
                   Colormap: [256×3 double]
               DisplayRange: [-160 240]
               ScaleFactors: [1 1 1]
    DisplayRangeInteraction: 'on'

Update the primary slice orientation of a CT volume from transverse to coronal.
Download Images
Download a file containing two CT chest volumes from the Medical Segmentation Decathlon data set [1]. The size of the data file is approximately 76 MB. Run this code to download the data set from the MathWorks® website and unzip the folder.
zipFile = matlab.internal.examples.downloadSupportFile("medical","MedicalVolumeNIfTIData.zip");
filepath = fileparts(zipFile);
unzip(zipFile,filepath)
dataFolder = fullfile(filepath,"MedicalVolumeNIfTIData");
Specify the path of the folder that contains the downloaded and unzipped data for the first volume.
filePath = fullfile(dataFolder,"lung_027.nii.gz");Import Data as Medical Volume
Load the CT volume as a medicalVolume object. Note that the Orientation property value is "transverse", indicating the primary orientation is the transverse plane.
medVol = medicalVolume(filePath)
medVol =
  medicalVolume with properties:

                  Voxels: [512×512×264 single]
          VolumeGeometry: [1×1 medicalref3d]
            SpatialUnits: "mm"
             Orientation: "transverse"
            VoxelSpacing: [0.8594 0.8594 1.2453]
            NormalVector: [0 0 -1]
        NumCoronalSlices: 512
       NumSagittalSlices: 512
     NumTransverseSlices: 264
            PlaneMapping: ["sagittal"    "coronal"    "transverse"]
    DataDimensionMeaning: ["left"    "anterior"    "superior"]
                Modality: "unknown"
           WindowCenters: 0
            WindowWidths: 0
View the medicalVolume object using sliceViewer, which opens a new scrollable window that displays transverse slices.
sliceViewer(medVol)

Update Orientation to Coronal
Update the primary orientation to the coronal plane.
In the updated medicalVolume, the Orientation property value is "coronal". The DataDimensionMeaning property indicates the order and positive direction for all three dimensions of the voxel data in the Voxels property. When you specify the new orientation as a scalar string, the function uses default directions for the other dimensions. To fully define the new orientation, specify the orientationCode input argument as a 3-element string array.
medVolReoriented = updateOrientation(medVol,"coronal")medVolReoriented =
medicalVolume with properties:
Voxels: [264×512×512 single]
VolumeGeometry: [1×1 medicalref3d]
SpatialUnits: "unknown"
Orientation: "coronal"
VoxelSpacing: [0.8594 1.2453 0.8594]
NormalVector: [0 1 0]
NumCoronalSlices: 512
NumSagittalSlices: 512
NumTransverseSlices: 264
PlaneMapping: ["transverse" "sagittal" "coronal"]
DataDimensionMeaning: ["inferior" "left" "posterior"]
Modality: "unknown"
WindowCenters: []
WindowWidths: []
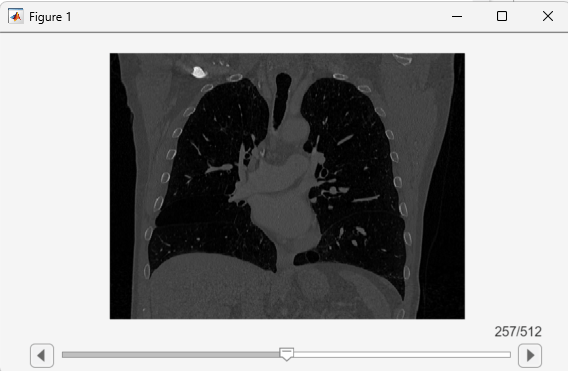
View the updated volume using sliceViewer, verifying that the window displays coronal slices.
sliceViewer(medVolReoriented)
[1] Medical Segmentation Decathlon. "Lung." Tasks. Accessed May 10, 2018. http://medicaldecathlon.com/.
The Medical Segmentation Decathlon data set is provided under the CC-BY-SA 4.0 license. All warranties and representations are disclaimed. See the license for details.
If you are working with 3-D medical image data stored as a DICOM, NIfTI, or NRRD file, create a medicalVolume object before displaying the volume. Passing a medicalVolume object as input allows sliceViewer to use the medicalVolume properties to automatically adjust display settings. If your medical image volume data is stored in a format that is not supported by medicalVolume, you can pass a numeric array as input to the sliceViewer object. The viewer displays the rows, columns, and slices of the data without any knowledge of a patient coordinate system.
Load a MAT file that contains an MRI image volume. The file loads the 3-D numeric array mristack into the workspace.
load mristack.matDisplay the slices of the MRI volume. By default, sliceViewer displays slices along the third direction of the numeric array.
sliceViewer(mristack,Parent=figure)
ans =
  sliceViewer with properties:

             SliceDirection: [0 0 1]
                SliceNumber: 11
                     Parent: [1×1 Panel]
                   Colormap: [256×3 double]
               DisplayRange: [0 255]
               ScaleFactors: [1 1 1]
    DisplayRangeInteraction: 'on'

More About
Version History
Introduced in R2023a