Run Polyspace as You Code in Visual Studio and Review Results
Run a Polyspace® as You Code™ analysis to identify critical defects and security vulnerabilities early in the development process. Polyspace as You Code is integrated as a plugin into your IDE allowing you to run an analysis and displays the results of your analysis without switching between applications. You can choose to run Polyspace as You Code automatically every time you save a file in Visual Studio®, or manually on-demand. The analysis runs on the file that is currently active in the IDE. (The file must be part of a Visual Studio project, which can be part of a Visual Studio solution.) After analysis, you see defects and coding standard violations as source code markers or in a separate list.
Run Analysis
You can run a Polyspace as You Code analysis in two ways: when you save a file that is in the Quality Monitoring view, or manually on-demand.
Run Analysis On Save
By default, Polyspace as You Code adds the current file to the Quality Monitoring view when you save the file, but does not start the analysis.
To enable the analysis of the current file when you save the file, click ![]() in the Quality Monitoring
view and in the Options dialog box, select Start analysis on
save.
in the Quality Monitoring
view and in the Options dialog box, select Start analysis on
save.
Run Analysis Manually
To disable starting an analysis when you save a file, click ![]() in the Quality Monitoring
view and then clear the Start analysis on save checkbox.
in the Quality Monitoring
view and then clear the Start analysis on save checkbox.
To start an analysis manually, do one of the following:
Right-click a file in the Quality Monitoring view and select Run Polyspace Analysis.
Click
 in the Quality
Monitoring view to run an analysis on each file in the
Quality Monitoring list sequentially.
in the Quality
Monitoring view to run an analysis on each file in the
Quality Monitoring list sequentially. Right-click the file in the editor and select Polyspace > Run Polyspace Analysis.
Review Results
After analysis, the results appear in two forms:
As red underlines in the source code.
As a list in the Error List view.
If you select a result in the Error List view, you see additional details about the result in the Result Details view. Click
 to open the contextual help for the
currently selected result.
to open the contextual help for the
currently selected result.
Double-click a result in the Error List view to navigate to the corresponding source code. If the analysis fails, check the messages in the Output view to diagnose the cause of the failure.
If results do not appear, see Troubleshoot Failed Analysis or Unexpected Results in Polyspace as You Code.
View Context-Sensitive Help for Result
You can see more information on a type of result by visiting the context-sensitive help page for the result.
To open the context-sensitive help for a result, select that result in your code
or in the Error List, and then click ![]() in the Result Details
view.
in the Result Details
view.
You can also open the full searchable documentation for the Polyspace
as You Code extension in your system browser by clicking ![]() in the Baseline,
Configuration, or Quality Monitoring
view.
in the Baseline,
Configuration, or Quality Monitoring
view.
Apply Suggested Fix for Common Defects or Coding Rule Violations
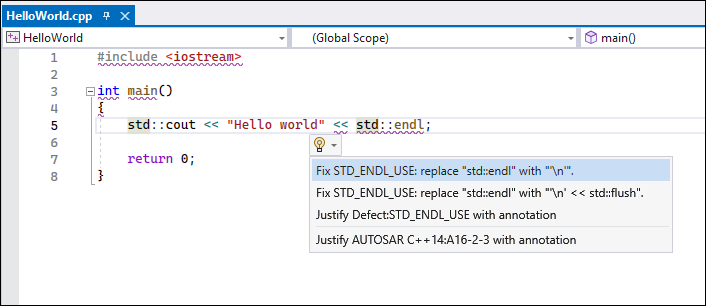
If Polyspace reports certain common defects or coding rule violations in your code, the Polyspace as You Code extension proposes one or more fixes that you can apply to these results.
To apply a quick fix, hover over a result in the editor and select the light bulb ![]() icon. Quick fix options have the format
Fix
icon. Quick fix options have the format
Fix checkerName:
proposedFix. Here,
checkerName is the name of the selected defect
checker or coding rule, and proposedFix is the fix that
Polyspace applies to your code. Polyspace edits your code and fixes the issue or all instances of the issue in
the currently active file, depending on the option that you select. If there is more
than one proposed fix, you see all available fixes in the menu.
This table lists the common defects and coding rule violations for which Polyspace proposes a fix, along with the Polyspace checkers that report these issues.
| Common Defect or Coding Rule Violation | Polyspace Checkers That Report the Issue |
|---|---|
Function that could be evaluated a compile time missing
constexpr specifier |
|
Inefficient use of std::any_cast to cast
object by value |
|
Inefficient use of std::string
operator+() |
|
Inefficient use of the [] operator to
insert or assign a value to a key in a
std::map or
std::unordered_map (C++ 17 and later
only) |
|
| Parameter passed by value results in expensive copy |
|
| Unmodified expensive-to-copy parameter passed by value |
|
Unmodified local variable is created by expensive copy from a
const reference |
|
Unmodified variable not declared
const |
|
Unnecessary call to std::move in a return
statement |
|
| Unused include |
|
| Unused parameter |
|
Use of std::endl |
|
Justify Results Using Code Annotations
If you decide not to fix a result, you can justify the result by adding code annotations. If the annotations follow a specific syntax, subsequent Polyspace as You Code runs can read these annotations and suppress the corresponding result.
To add a code annotation, right-click a result in the Error List view and select Polyspace > Justify the current result. The annotation is entered on the same line as the result. You can also apply an annotation by pointing to the code marker for that result. For more details on annotations, see Annotate Code and Hide Known or Acceptable Results (Polyspace Bug Finder).
To justify all results of the same defect or coding rule violation in the current file, right-click a result in the Error List view and select Polyspace > Justify all instances of the selected finding. Polyspace inserts an annotation in your code on each line that contains this result.
If you import review information from a baseline run, any status, severity, or comment from the baseline run is automatically applied to the corresponding Polyspace as You Code result.
Findings with an imported status of
Not a defect,Justified, orNo action plannedare removed from the Error List view and those results are suppressed in subsequent analyses.
Polyspace
as You Code inserts code annotations as comments enclosed in /*
*/ or C files and prefixed with // in C++ files.
The comment format in C files complies with MISRA C:2004 Rule 2.2. See (Not recommended) MISRA C:2004 and MISRA AC AGC Rules (Polyspace Bug Finder).
You can import your own justification catalog as a JSON file that uses the Polyspace code annotation syntax. For details, see Use a Justification Catalog to Autocomplete Annotations in Polyspace as You Code Plugins.