Interpret Bug Finder Results in Polyspace Access Web Interface
When you open the results of a Bug Finder analysis in the Review perspective of Polyspace® Access™, you see a list on the Results List pane. The results consist of defects, coding rule violations or code metrics.
You can first narrow down the focus of your review:
Use filters in the toolstrip to narrow down the list. For instance, you can focus on the high-impact defects.
Click the a column header in the Results List to sort the list according to the content of that column. For instance you can sort by Group or by File.
Once you narrow down and sort the list, you can begin reviewing individual results. This topic describes how to review a result.
To begin your review, select a result in the list.
Interpret Result Details Message
The first step is to understand what is wrong. Read the message on the Result Details pane and the related line of code on the Source Code pane.
Sometimes, you need additional help for certain results. Click the ![]() icon to open a help page for the selected result.
See code examples illustrating the result. Check external standards such as CERT-C
that provide additional rationale for fixing the issue. When available, click the
icon to open a help page for the selected result.
See code examples illustrating the result. Check external standards such as CERT-C
that provide additional rationale for fixing the issue. When available, click the ![]() icon to see fix suggestions for the
defect.
icon to see fix suggestions for the
defect.
At this point, you might be ready to decide whether to fix the issue or not. Once you identify a fix, it might help to review all results of that type together.
Find Root Cause of Result
Sometimes, the root cause might be far from the actual location where the result
is displayed. For instance, a variable that you read might be non-initialized
because the initialization is not reachable. The defect is shown when you read the
variable, but the root cause is perhaps a previous if or
while condition that is always false.
Navigate to Related Events
Typically, the Result Details pane shows one sequence of events that leads to the result. The Source Code pane also highlights these events.

In the above event traceback, this sequence is shown:
A variable
valueis declared.The execution path bypasses an
ifstatement. This information might be relevant if the variable is initialized inside theifblock.Location of the current defect: Non-initialized variable
Typically, the traceback shows major points in the control flow: entering or bypassing conditional statements or loops, entering a function, and so on. For specific defects, the traceback shows other kinds of events relevant to the defect. For instance, for a Declaration mismatch defect, the traceback shows the two locations with conflicting declarations.
Create Your Own Navigation Path
If the event traceback is not available, use other navigation tools to trace your own path through the code.
Before you begin navigating through pathways in your code, ask the question: What am I looking for? Based on your answer, choose the appropriate navigation tool. For instance:
To investigate a Non-initialized variable defect, you might want to make sure that the variable is not initialized at all. To look for previous instances of the variable, on the Source Code pane, right-click the variable and select Search For All References. This option lists only instances of a specific variable and not other variables with the same name in other scopes.
To investigate a violation of MISRA C:2012 Rule 17.7:
you might want to navigate from a function call to the function definition. Right-click the function and select Go To Definition.The value returned by a function having non-void return type shall be used.
If you navigate away from the current result in the Source
Code pane, click the ![]() icon in the Result
Details pane to return to the location of the result in the
Source Code pane.
icon in the Result
Details pane to return to the location of the result in the
Source Code pane.
To select a different result from the Source Code pane,
Ctrl-click the result or right-click and select a result
from the Select Results submenu. The
Results Details pane updates but the result you select
is not highlighted in the Results List pane. Clicking a
result in the Results List updates the Results
Details and Source Code panes.
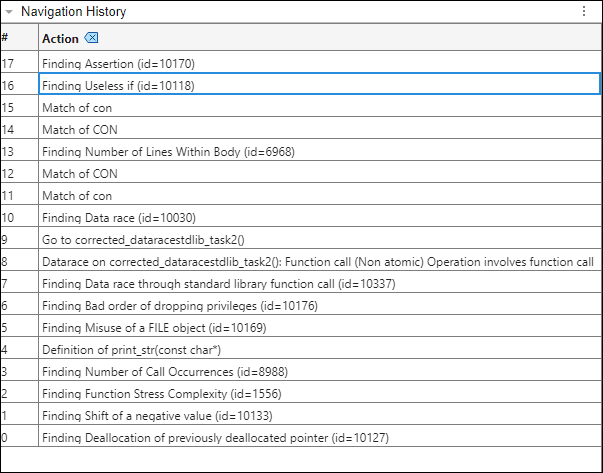
Store Source Code Pane Navigation and Polyspace Actions
Polyspace displays certain review workflow actions in the Navigation History pane.
Click on an action in the Navigation History pane to open the relevant result in the Result Details pane. Then navigate within the Source Code pane to the location of the code associated with the action. As you continue your results review process, use the Navigation History pane to refer back to previous results and locate the associated code in the Source Code pane.
The actions Polyspace records include:
Selecting a result in the Results List pane
Selecting Keep position in Navigation History from the Source Code pane right-click menu
Selecting a node in a graph, such as the Error Call Graph or the Variable Access Graph
Selecting a row in the Code Search, Call Hierarchy, Global Variable Usage, or Global Variable Accesses panes
Flag an important action in the Navigation History pane by clicking the row number of the action.
Click the ![]() icon to remove all actions from the
Navigation History pane.
icon to remove all actions from the
Navigation History pane.