Main Content

rcssphere

Radar cross section of sphere

Since R2021a

Description

example

rcspat = rcssphere(r,c,fc) returns the radar cross section pattern of a sphere of radius r as a function of signal frequency, fc, and signal propagation speed, c. The center of the sphere is assumed to be located at the origin of the local coordinate system.

example

rcspat = rcssphere(r,c,fc,az,el) also specifies the azimuth angles, az, and elevation angles, el, at which to compute the radar cross section.

example

[rcspat,azout,elout] = rcssphere(___) also returns the azimuth angles, azout, and elevation angles, elout, at which the radar cross sections are computed. You can use these output arguments with any of the previous syntaxes.

Examples

collapse all

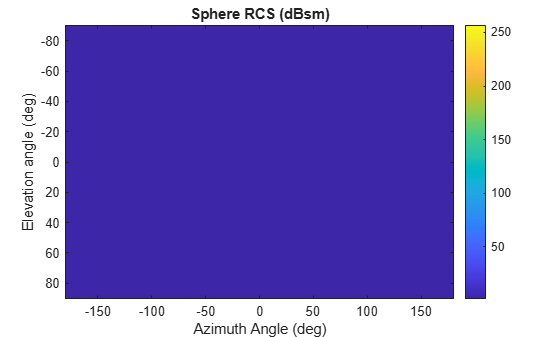
Display the radar cross section (RCS) pattern of a sphere as a function of azimuth and elevation. The sphere radius is 20.0 cm. The operating frequency is 4.5 GHz.

Define the sphere radius and signal parameters.

c = physconst('Lightspeed');
fc = 4.5e9;
rad = 0.20;

Compute the RCS over all angles. The image shows that the RCS is constant over all directions.

[rcspat,azresp,elresp] = rcssphere(rad,c,fc);
image(azresp,elresp,pow2db(rcspat))
colorbar
ylabel('Elevation angle (deg)')
xlabel('Azimuth Angle (deg)')
title('Sphere RCS (dBsm)')

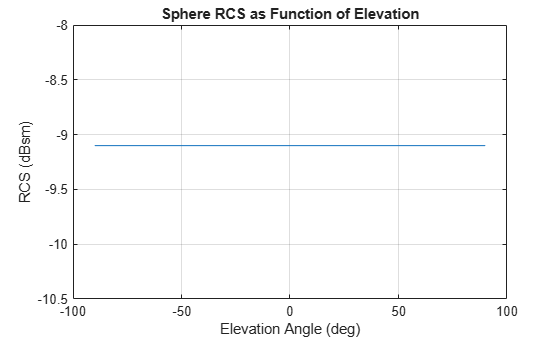
Plot the radar cross section (RCS) pattern of a sphere as a function of elevation angle for a fixed azimuth angle of 5 degrees. The sphere radius is 20.0 cm. The operating frequency is 4.5 GHz.

Specify the sphere radius and signal parameters.

c = physconst('LightSpeed');
rad = 0.20;
fc = 4.5e9;

Compute the RCS over a constant azimuth slice. The plot shows that the RCS is constant.

az = 5.0;
el = -90:90;
[rcspat,azresp,elresp] = rcssphere(rad,c,fc,az,el);
plot(elresp,pow2db(rcspat))
xlabel('Elevation Angle (deg)')
ylabel('RCS (dBsm)')
title('Sphere RCS as Function of Elevation')
grid on

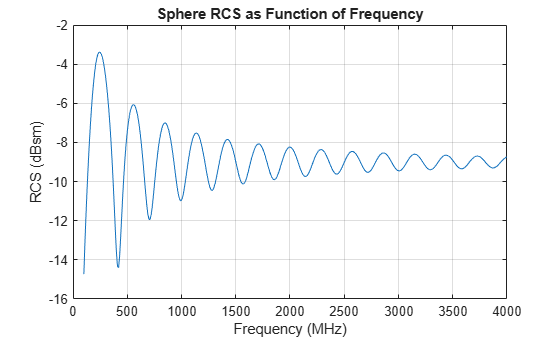
Plot the radar cross section (RCS) pattern of a sphere as a function of frequency for a single azimuth and elevation. The radius of the sphere is 20 cm

Define the sphere radius and signal parameters.

c = physconst('Lightspeed');
rad = 0.20;

Compute the RCS over a range of frequencies for a single direction.

az = 5.0;
el = 20.0;
fc = (100:10:4000)*1e6;
[rcspat,azpat,elpat] = rcssphere(rad,c,fc,az,el);
disp([azpat,elpat])
     5    20
plot(fc/1e6,pow2db(squeeze(rcspat)))
xlabel('Frequency (MHz)')
ylabel('RCS (dBsm)')
title('Sphere RCS as Function of Frequency')
grid on

Input Arguments

collapse all

Radius of sphere, specified as a positive scalar. Units are in meters.

Example: 5.5

Data Types: double

Signal propagation speed, specified as a positive scalar. Units are in meters per second. For the SI value of the speed of light, use physconst('LightSpeed').

Example: 3e8

Data Types: double

Frequency for computing radar cross section, specified as a positive scalar or positive, real-valued, 1-by-L row vector. Frequency units are in Hz.

Example: [100e6 200e6]

Data Types: double

Azimuth angles for computing directivity and pattern, specified as a real-valued 1-by-M row vector where M is the number of azimuth angles. Angle units are in degrees. Azimuth angles must lie between –180° and 180°, inclusive.

The azimuth angle is the angle between the x-axis and the projection of a direction vector onto the xy-plane. The azimuth angle is positive when measured from the x-axis toward the y-axis.

Example: -45:2:45

Data Types: double

Elevation angles for computing directivity and pattern, specified as a real-valued, 1-by-N row vector where N is the number of desired elevation directions. Angle units are in degrees. Elevation angles must lie between –90° and 90°, inclusive.

The elevation angle is the angle between a direction vector and xy-plane. The elevation angle is positive when measured towards the z-axis.

Example: -75:1:70

Data Types: double

Output Arguments

collapse all

Radar cross section pattern, returned as a real-valued N-by-M-by-L array. N is the length of the vector returned in the elout argument. M is the length of the vector returned in the azout argument. L is the length of the fc vector. Units are in meters-squared.

Data Types: double

Azimuth angles for computing directivity and pattern, returned as a real-valued 1-by-M row vector where M is the number of azimuth angles specified by the az input argument. Angle units are in degrees.

The azimuth angle is the angle between the x-axis and the projection of the direction vector onto the xy-plane. The azimuth angle is positive when measured from the x-axis toward the y-axis.

Data Types: double

Elevation angles for computing directivity and pattern, returned as a real-valued 1-by-N row vector where N is the number of elevation angles specified in el output argument. Angle units are in degrees.

The elevation angle is the angle between the direction vector and xy-plane. The elevation angle is positive when measured towards the z-axis.

Data Types: double

More About

collapse all

Azimuth and Elevation

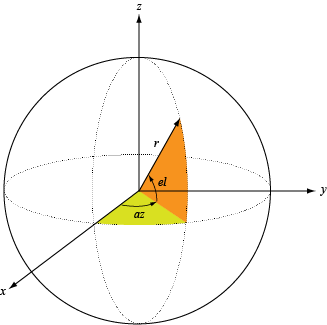
This section describes the convention used to define azimuth and elevation angles.

The azimuth angle of a vector is the angle between the x-axis and its orthogonal projection onto the xy-plane. The angle is positive when going from the x-axis toward the y-axis. Azimuth angles lie between –180° and 180° degrees, inclusive. The elevation angle is the angle between the vector and its orthogonal projection onto the xy-plane. The angle is positive when going toward the positive z-axis from the xy-plane. Elevation angles lie between –90° and 90° degrees, inclusive.

References

[1] Mahafza, Bassem. Radar Systems Analysis and Design Using MATLAB, 2nd Ed. Boca Raton, FL: Chapman & Hall/CRC, 2005.

Extended Capabilities

C/C++ Code Generation
Generate C and C++ code using MATLAB® Coder™.

Version History

Introduced in R2021a