Signal Monitoring and Parameter Tuning of Model Running on TI mmWave Radar Board
You can use the Monitor and Tune (external mode) workflow to adjust parameters and observe signals from a Simulink® model running on the ARM® Cortex® processor of the TI mmWave radar board. This allows you to change parameter values and see their effects on model behavior in real time, without restarting the simulation. Any changes you make to parameters are sent immediately to the hardware, and you can monitor outputs using Sink blocks or the Simulation Data Inspector in Simulink. This process helps you quickly find optimal parameter values, and lets you test and validate your model with real hardware and data—capabilities not possible with simulation alone. For more details, refer to Perform Monitor and Tune for Data Logging and Real-Time Execution
The Radar Toolbox Support Package for Texas Instruments® mmWave Radar Sensors supports Monitor and Tune simulation over the Universal Measurement and
Calibration Protocol (XCP)-based External mode simulation over serial connection
(XCP on Serial communication interface).
You can use:
Sources (Simulink) blocks, Sink (Simulink) blocks, and Dashboard (Simulink) blocks to change parameter values and to monitor the effects of parameter tuning. If you use display-type blocks (like Display (Simulink)), signals are shown directly in the model. The Dashboard library contains set of blocks using which you can interactively control and visualize the model. For blocks such as Scope (Simulink), double-click the block to view the signal output.
Simulation Data Inspector (Simulink): You can inspect and compare data from multiple simulations to validate model designs using Simulation Data Inspector (SDI).
For details on visualization tools available in Simulink, refer to Decide How to Visualize Simulation Data (Simulink).
XCP-Based External Mode Simulation over Serial Connection
Follow the steps in Configure a New Model for TI mmWave Radar to configure the model for TI mmWave radar board.
Model your application as needed. To monitor signals, you can use Sink (Simulink) blocks, Dashboard (Simulink) blocks, or the SDI (Simulation Data Inspector (Simulink)).
Note
Logging or viewing many signals, or signals with large data sizes, through Sink blocks, Dashboards, or SDI may impact performance. It’s best to log or view only the necessary signals.
In the Simulation tab of your Simulink model, set the simulation Stop Time parameter. The default is 600.0 seconds. To run the model continuously, enter
inf.Connect the TI mmWave radar board to your computer’s USB port. Simulink attempts to automatically detect the COM port. If multiple devices are connected or you encounter a COM port error, identify the correct COM port and specify it in the Configuration Parameters. Simulink uses the COM port corresponding to Config port for the communication with the device. Follow the steps in Identifying Serial Ports for TI mmWave Radar Connection to identify the Config port corresponding to the device.
To start external mode simulation, go to the Hardware tab in your Simulink model and click Monitor & Tune under the Run on Hardware section.

The status of the build, deployment, and execution process is displayed in the lower left corner of the Simulink window as the model is prepared, downloaded, and run on the hardware.
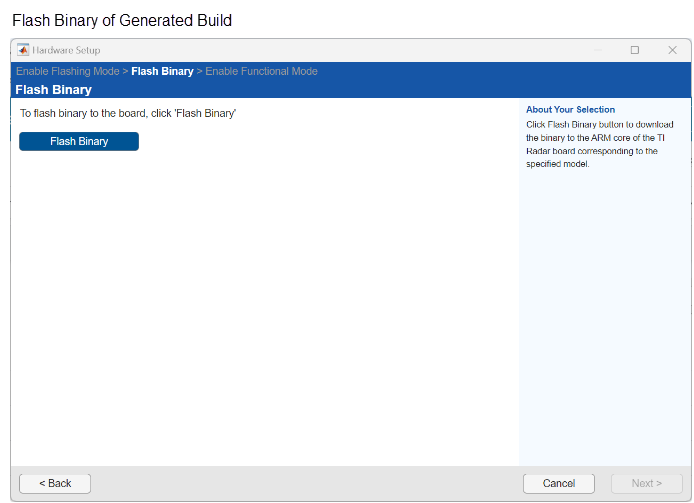
Once the executable is created, the Simulink window will become non-interactive and the Hardware Setup windows will appear. These windows provide step-by-step instructions for setting the flashing mode on the TI mmWave radar board, flashing the generated binary, and returning the board to functional mode. You’ll need to change switch positions as described in the instructions. After each step, click Next to continue.
Images of the hardware setup screens for the AWR1843BOOST board are shown below. The screens will update based on the hardware board you selected in the Configuration Parameters.
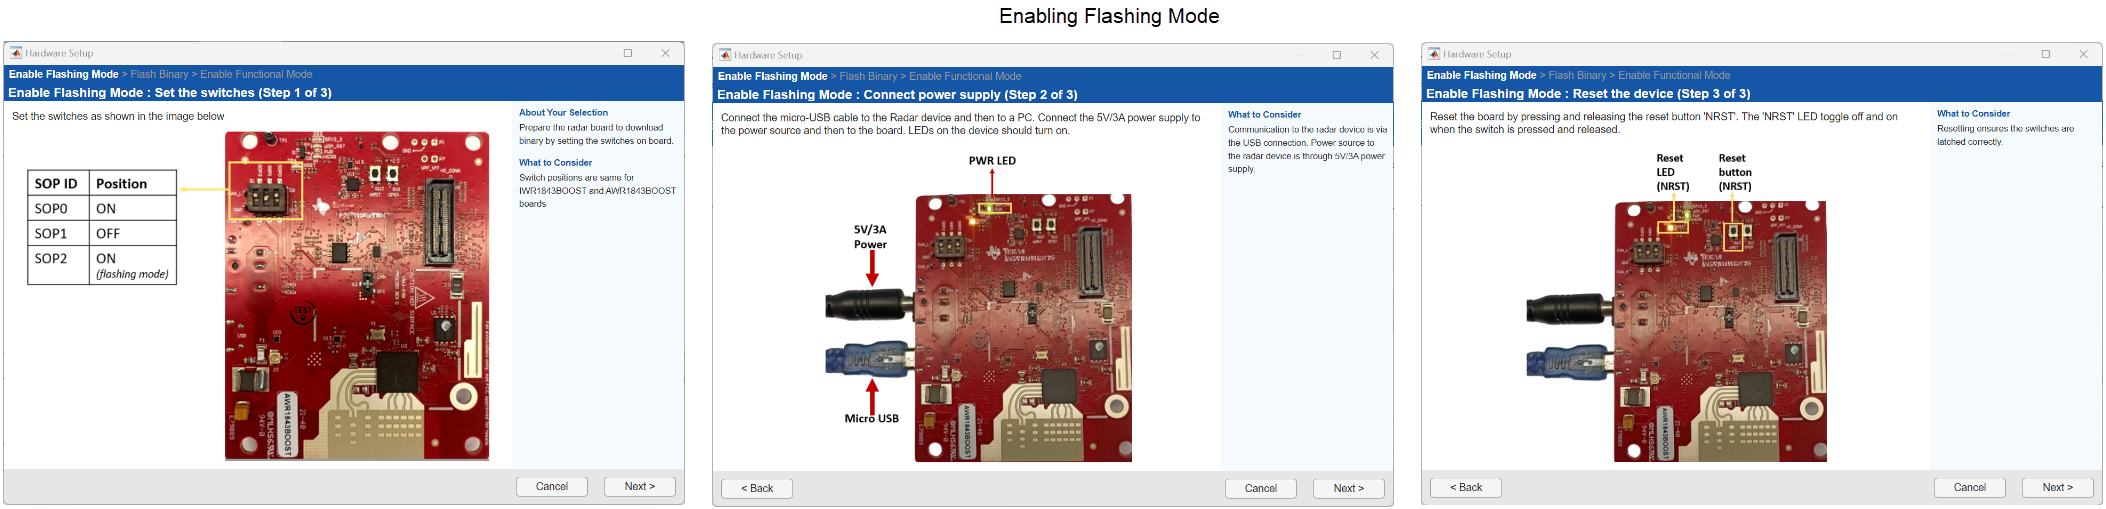
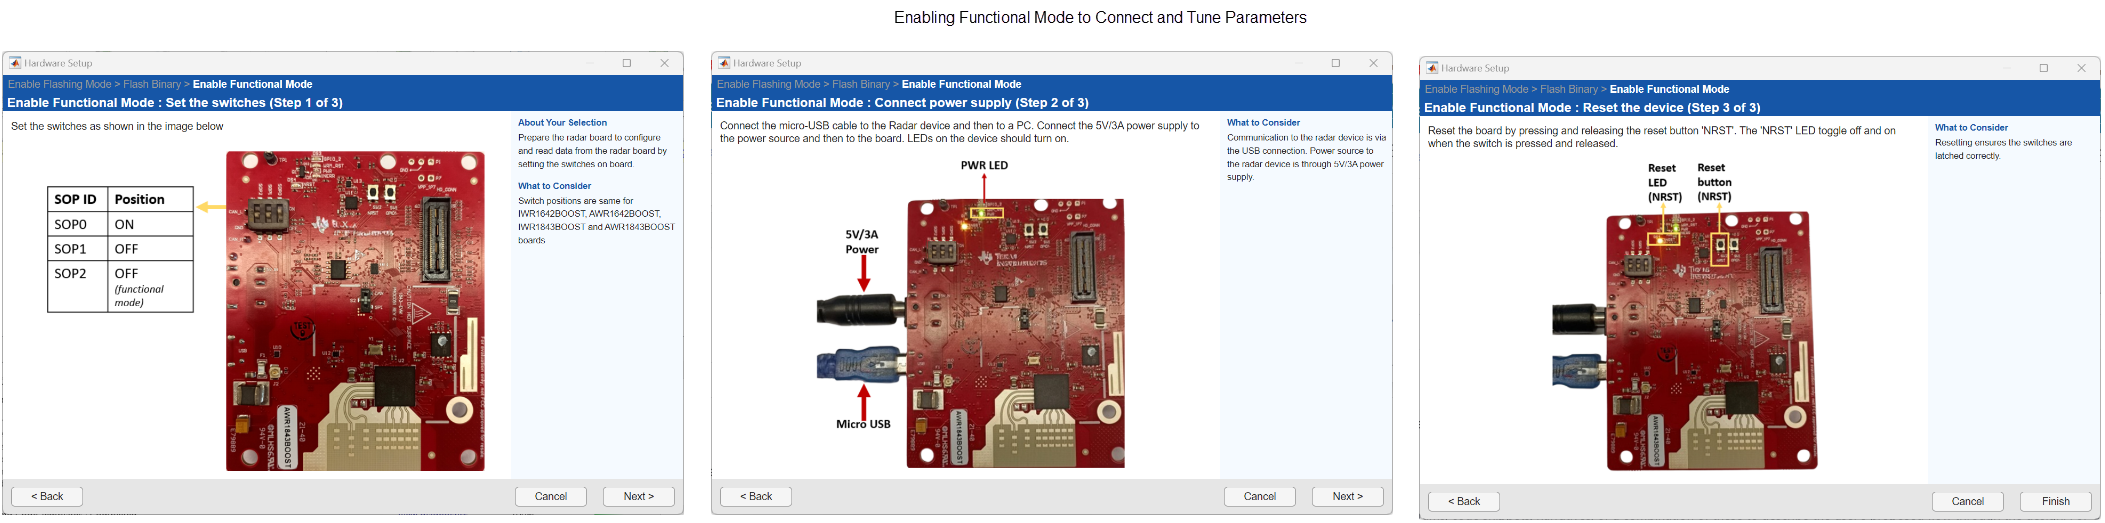
After you click Finish at the final step and complete the required switch settings and reset, you can interact with the Simulink window again. Once all hardware setup steps are complete, the generated code will start running on the TI Radar device.
Note
Click Finish only after you have made the necessary switch changes and performed a reset.
While the model is running in external mode, you can monitor signals using the Simulation Data Inspector, Sink blocks, or Dashboard blocks in your model.
You can tune parameters for any blocks that are not greyed out while the model is running on the hardware. For a full example, see Getting Started with Deploying Applications to the ARM Cortex Core of Texas Instruments mmWave Radars.
After you have finished, stop the Monitor and Tune process.
To stop the model that is running in Monitor and Tune, on the Hardware tab, click Stop
 .
.If the simulation Stop Time parameter is set to a specific number of seconds, Monitor and Tune stops when that time elapses.
Tools for Monitoring Signals
You can monitor signals in your model using Dashboard blocks, Sink blocks, or the Simulink Data Inspector (SDI).
Dashboard and Sink Blocks
You can use Sink (Simulink) blocks and Dashboard (Simulink) blocks to change parameter values and to monitor the effects of parameter tuning. If you use display-type blocks (like Display (Simulink)), signals are shown directly in the model. For blocks such as Scope (Simulink), double-click the block to view the signal output.
Simulink Data Inspector
To log and view signals in Simulink Data Inspector, follow these steps:
In the Simulink model, identify the signals to be logged for monitoring during simulation. Select the identified signal, open its context menu, and click the icon corresponding to Log Selected Signal.
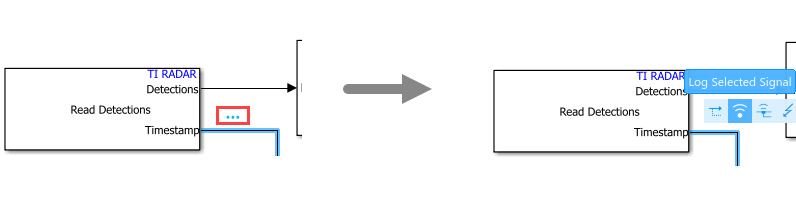
Simulink displays a logged signal indicator
 for each logged signal.
On the Hardware tab, click Monitor & Tune (or use Build, Deploy & Start followed by Connect and Start under Step-By-Step Commands). This will build, deploy, and start your model on the hardware.
View Data in SDI.
While the simulation is running, open the SDI by clicking its button
 in the Simulink toolstrip (found in
either the Hardware tab or under Review
Results).
in the Simulink toolstrip (found in
either the Hardware tab or under Review
Results).The SDI window opens and displays your logged signals in the Inspect pane.
Select the signals you want to plot and monitor them in real time.
While the simulation is running, you can tune model parameters and instantly see the effects on your logged signals in the SDI, with data streamed directly from the hardware. For details, refer to Decide How to Visualize Simulation Data (Simulink).
See Also
Perform Monitor and Tune for Data Logging and Real-Time Execution | Decide How to Visualize Simulation Data (Simulink)