Create Tables from MATLAB Tables
To create a DOM API table from a MATLAB® table, use an mlreportgen.dom.MATLABTable object. The DOM
representation of a MATLAB table has the structure of a DOM formal table. See Create Formal Tables. The
MATLABTable header contains the column names from the MATLAB table. The MATLABTable body contains the rows and elements from
the MATLAB table.
If the table in MATLAB has row names, the first column of the MATLABTable object
contains the row names. In MATLAB, the row name column does not have a label. In the MATLABTable
object, you can specify a label for the row name column by changing the content of the first
element of the header. You can specify a line under the row name column label by setting the
RowNamesRule property of the MATLABTable object to
true.
For information about other types of tables that you can create in reports, see Choose Type of Table to Create in Report Generator.
Create a Table from a MATLAB Table
This example creates a DOM table from a MATLAB table that has row names. The example generates two reports that include the DOM table. In the first report, the row names column of the table does not have a label. In the second report, the row names column has a label.
Create a MATLAB table that shows the age, weight, and height of patients. Use the RowNames option to identify each row by the last name of the patient.
LastName = {'Sanchez';'Johnson';'Lee';'Diaz';'Brown'};
Age = [38;43;38;40;49];
Weight = [176;163;131;133;119];
Height = [71;69;64;67;64];
mltable = table(Age,Weight,Height,'RowNames',LastName)mltable=5×3 table
38 176 71
43 163 69
38 131 64
40 133 67
49 119 64
The MATLAB table has five rows and three columns. The row names are not part of the table. They are stored in a property of the table.
Create an mlreportgen.dom.MATLABTable object from the MATLAB table.
import mlreportgen.dom.*
mltableObj = MATLABTable(mltable);
Create a document and append the MATLABTable object to the document. Close and view the document.
d = Document('MyMATLABTable1','docx');
append(d,mltableObj);
close(d);
rptview(d);
Here is the table in the generated report:
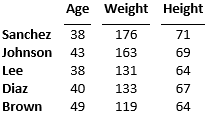
The DOM table is a formal table, which has a header and a body. The table body has five rows and four columns. The first column consists of the MATLAB table row names.
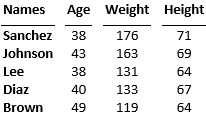
Generate the report again, this time with a label for the column of row names. To specify the label, replace the empty text in the first entry of the table header row with the label text. To draw a line under the label, set the RowNamesRule property of the MATLABTable object to true.
LastName = {'Sanchez';'Johnson';'Lee';'Diaz';'Brown'};
Age = [38;43;38;40;49];
Weight = [176;163;131;133;119];
Height = [71;69;64;67;64];
mltable = table(Age,Weight,Height,'RowNames',LastName);
import mlreportgen.dom.*
mltableObj = MATLABTable(mltable);
th = mltableObj.Header;
thentry11 = entry(th,1,1);
thentry11.Children(1).Children(1).Content = 'Names';
mltableObj.RowNamesRule = true;
d = Document('MyMATLABTable2','docx');
append(d,mltableObj);
close(d);
rptview(d);
Here is the table in the generated report:
Format a Table Created from a MATLAB Table
By default, a table generated from a MATLABTable object is formatted to
look like a table in MATLAB. To customize the appearance of the table, you can use the same approaches
that you use for other types of tables:
Update the default style in the style sheets of the default HTML, Word, or PDF template. The default
StyleNameof aMATLABTableobject is"rgMATLABTable".Set the
StyleNameproperty to a custom style.Use format properties or format objects with the table or a section of the table.
See Format Tables.
Format the Sections of a MATLAB Table
This example shows how to format the sections of a DOM table that is created from a MATLAB table.
Format the Table Header
This example makes the column headings italic.
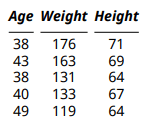
To access the header, use the Header property of the mlreportgen.dom.MATLABTable object. The example adds an mlreportgen.dom.Italic format object to the Style property of the mlreportgen.dom.TableHeader object that represents the header.
import mlreportgen.dom.*
d = Document('myMATLABTable','pdf');

Age = [38;43;38;40;49];
Height = [71;69;64;67;64];
Weight = [176;163;131;133;119];
mltable = table(Age,Weight,Height);

mltableObj = MATLABTable(mltable);
mltableObj.Header.Style = [mltableObj.Header.Style {Italic(true)}];

append(d,mltableObj);
close(d);
rptview(d);
Format the Table Body
This example makes the entries of the first row of the table body blue.
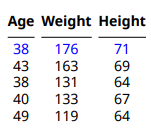
To access the table body, use the Body property of the mlreportgen.dom.MATLABTable object. To access a row of the body, use the row method of the mlreportgen.dom.TableRow object that represents the row. The example adds an mlreportgen.dom.Color format object to the Style property of the TableRow object that represents the first row.
import mlreportgen.dom.*
d = Document('myMATLABTable','pdf');

Age = [38;43;38;40;49];
Height = [71;69;64;67;64];
Weight = [176;163;131;133;119];
mltable = table(Age,Weight,Height);

mltableObj = MATLABTable(mltable);
tbody = mltableObj.Body;
row1 = row(tbody,1);
row1.Style = [row1.Style {Color('blue')}];

append(d,mltableObj);
close(d);
rptview(d);