Simulink.sdi.plot
R2026bPlot data in Simulation Data Inspector
Syntax
Description
Simulink.sdi.plot( opens the Simulation
Data Inspector and plots the data in the object obj)obj on the active
tab.
When the input object contains fewer than eight signals, the Simulation Data Inspector
layout changes to 1-by-n, where n
is the number of signals, and each subplot displays one signal. When the simulation results
contain more than eight signals to plot, the Simulation Data Inspector layout changes to
1-by-1, and the plot displays the first signal.
runObj = Simulink.sdi.plot(___)Simulink.sdi.Run object that corresponds to
the plotted data.
Examples
You can use the Simulink.sdi.plot function to plot simulation results in the Simulation Data Inspector. Open the model vdp, which models the second-order Van der Pol differential equation. For more information about the model, see Van der Pol Oscillator.
mdl = "vdp";
open_system(mdl)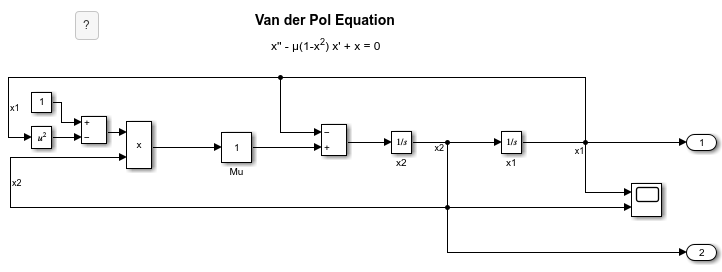
Simulate the model. The model logs two signals: x1 and x2. Simulation results are stored in a single SimulationOutput object named out.
out = sim(mdl);
Use the Simulink.sdi.plot function to open the Simulation Data Inspector and plot the results.
Simulink.sdi.plot(out);
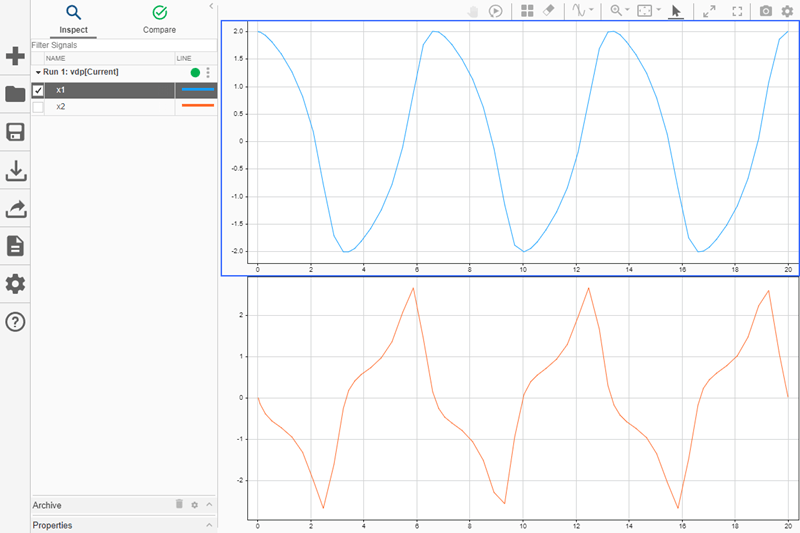
You can use the Simulink.sdi.plot function to plot data with respect to time in the Simulation Data Inspector.
time = 0:0.1:10;
data = sin(time);
Simulink.sdi.plot(data,time);
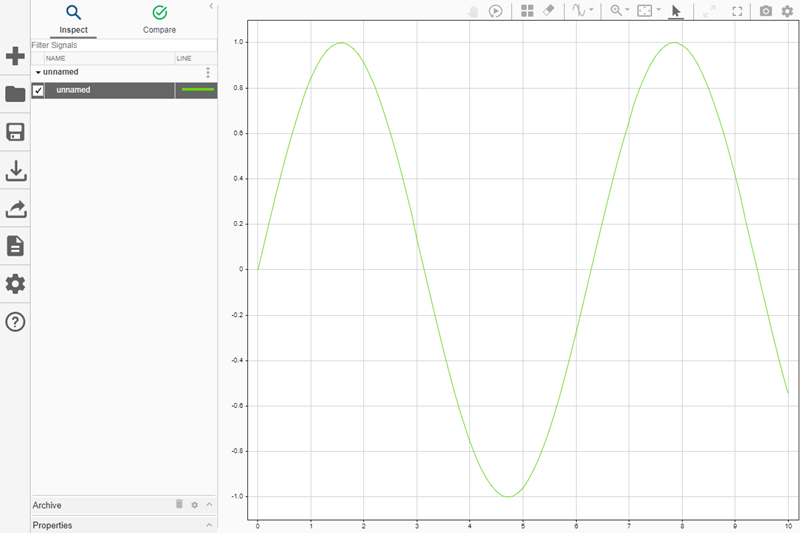
You can also plot an array of data values in the Simulation Data Inspector. The number of rows in the data array must match the length of the time vector. The number of columns in the data array corresponds to how many signals are plotted.
dataArray = rand(length(time),4);
Simulink.sdi.plot(dataArray,time);
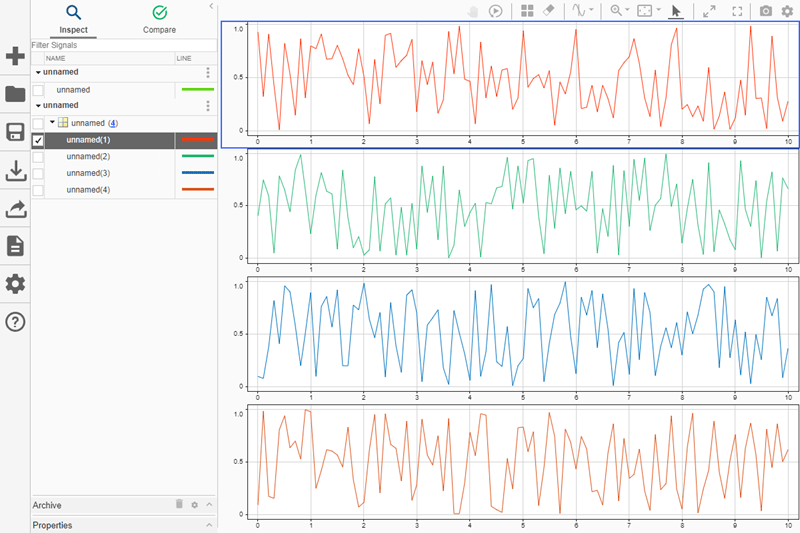
To plot data on a specific tab, specify the tab index using the
TabIndex name-value argument. For example, plot signal data on the
second tab in the Simulation Data Inspector.
runObj = Simulink.sdi.plot(out.logsout,TabIndex=2)
Input Arguments
Output Arguments
Version History
Introduced in R2019bSee Also
Objects
Simulink.SimulationData.BlockPath|Simulink.SimulationData.Signal|Simulink.SimulationData.DataStoreMemory|Simulink.SimulationData.Dataset|timeseries|timetable
Functions
plot|plotOnSubPlot|get|addElement

