Control Display of Streaming Data Using Triggers
A trigger is an event that determines when to draw the plot of a streaming signal. Trigger settings specify criteria for the trigger event and where the trigger event is displayed within the updated data. Triggers facilitate viewing and analyzing streaming data by allowing you to capture transient changes in signals and stabilize the display of steady-state periodic signals. You can use triggers to inspect streaming data using several tools, such as the Scope block and the Simulation Data Inspector. This example uses the Simulation Data Inspector add, configure, and modify triggers on signals streaming from a model simulation.
Note
The following examples add a trigger to signals that are plotted in the Simulation Data Inspector. However, you can add a trigger to a signal from the active simulation that is not plotted.
For complete descriptions of all trigger types and options, see Scope Triggers.
Examine the Model
The model in this example generates two logged output signals. Both signals are created by passing the output of a Sine Wave block through a switch. Both switches are configured to allow the sine signal through when the control signal is greater than zero. The switch for the first output is controlled by user input supplied using the Push Button block. The switch for the second output is controlled by the output of a Pulse Generator block.
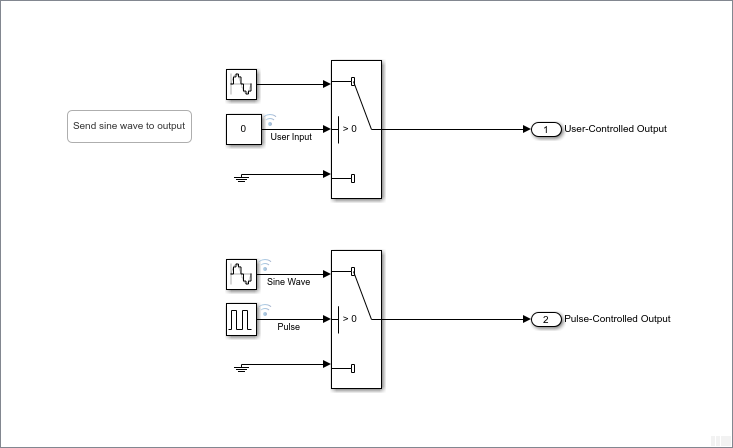
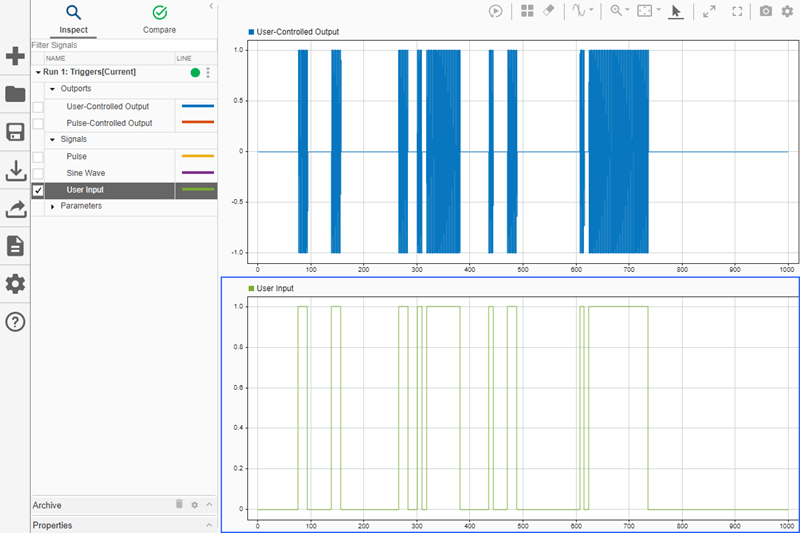
The model uses simulation pacing so the model behavior and signal display are responsive to user interaction. Click Run to start a simulation. Then, click Data Inspector to open the Simulation Data Inspector. In the Simulation Data Inspector, change the layout to show two subplots. Plot the User-Controlled Output signal on the top subplot and the User Input signal on the bottom subplot. Press and hold the Push Button block periodically throughout the simulation to pass the Sine Wave block output to the Outport block.
Interactively Generate Trigger Events
The sine wave characteristics are difficult to see when you view the signals over the entire simulation time. When you use a trigger to control when the plot updates, you can view the streaming data over a smaller time range, which allows you to see the sine wave more clearly. Using the trigger ensures that you see the signal behavior of interest in the smaller time range. In this example, you want to see the change in the output signal when you press the Push Button block.
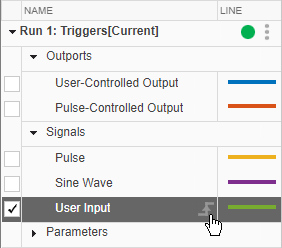
To trigger plot updates based on button presses, add a trigger to the User
Input signal. To add a trigger, pause on the row for the User
Input signal in the Simulation Data Inspector and click the trigger icon that appears.
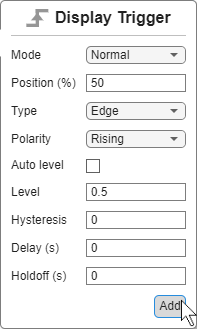
The default settings in the Display Trigger dialog box configure an auto-leveled
rising-edge trigger, with the trigger event positioned in the middle of the displayed data.
Change Mode to Normal, then clear the
Auto level check box and set the Level to
0.5. Then, click Add.
Using normal mode for the trigger means that the plot only updates when a trigger
occurs. In auto mode, the display also updates when a trigger is not detected for the
duration of the time span. The trigger level of 0.5 puts the level in the
middle of the signal range.
Before simulating the model, adjust the time range displayed in the plots. In the upper
right, click Visualization Settings ![]() . Then, set Time span to
. Then, set Time span to
50.
Simulate the model and view the streaming signals in the Simulation Data Inspector. When you start a new simulation, the trigger configured in the Simulation Data Inspector automatically transfers to the corresponding signal in the current simulation. The display updates in response to the trigger events you cause by pressing the Push Button block in the model. On the smaller time span, you can see the shape of the sine wave in the output signal. The trigger position and level are marked with green triangles. You can click and drag the trigger markers to adjust the level and position. A new value is applied for the level or position when you let go of the marker after dragging.
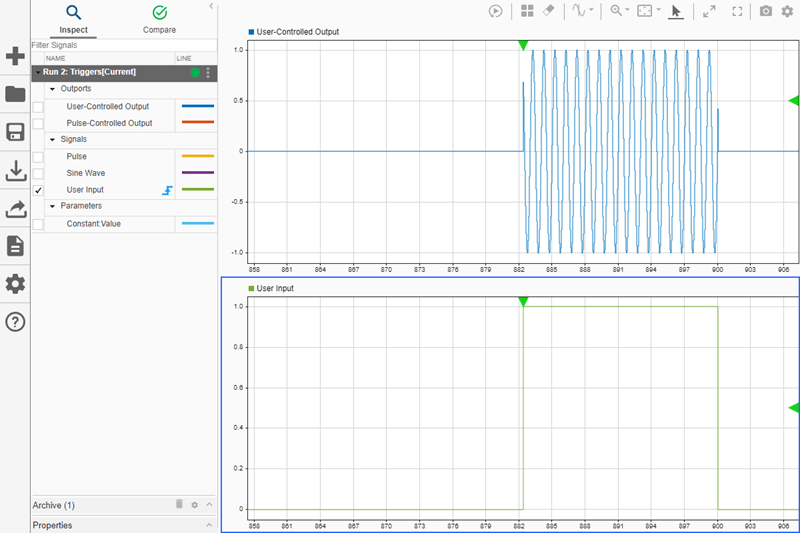
Experiment with this configuration to test out different kinds of triggers and different trigger settings. For example, try using a falling-edge trigger. You can also adjust the simulation pacing in the model to explore how timing can affect trigger behavior. When the trigger occurs, the Simulation Data Inspector collects all the data to display before updating the plot. If you slow the simulation pacing closer to a rate where one simulation second takes one second of clock time, you can see the delay between causing a trigger by pressing the Push Button block and the plot update in the Simulation Data Inspector.
Capture Signal Transient Response
A trigger allows you to capture transient signal responses to changes in the system
under test. For example, you can use the input signal to an inverter as a trigger when you
want to measure the rise or fall time for the inverter output signal. The display updates
only when the trigger occurs, so the data is displayed long enough for you to make a
measurement. When you interactively generate trigger events, you capture the output signal
transient response to the user input. Systems often do not have user input and respond to
changes in upstream signals, such as the Pulse signal that controls the
switch that generates the Pulse-Controlled Output signal.
Add a trigger to the Pulse signal in the Simulation Data Inspector.
Use a rising-edge trigger in normal mode with a level of 0.5 again. Click
Add Trigger in the warning dialog box that appears.
Before simulating the model, update the plots so that the Pulse-Controlled
Output is shown on the top plot and the Pulse signal is shown
on the bottom plot.
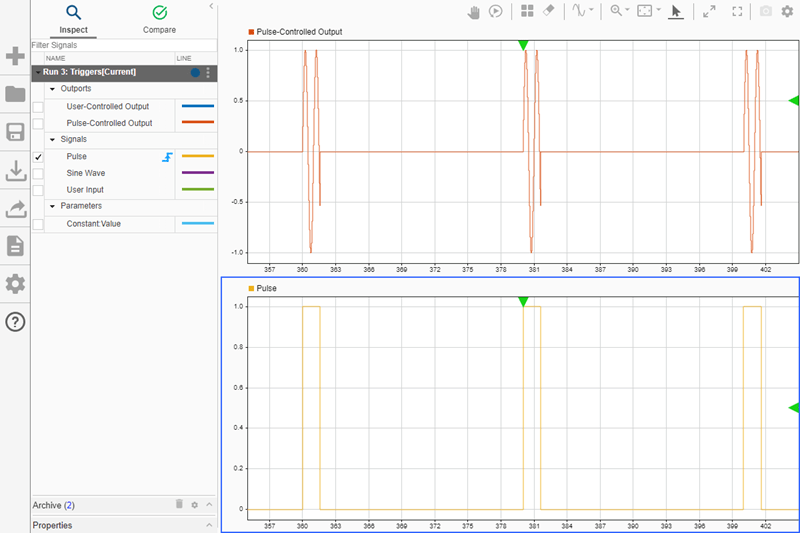
Simulate the model. The Simulation Data Inspector display updates are not triggered by
the user input in this simulation, so you do not need to press the Push
Button block. Observe how the Pulse-Controlled Output signal is
different from the User-Controlled Output signal from the previous
simulation and how the plot updates occur in response to the periodic
Pulse signal.
You can experiment in additional simulations by adjusting the pulse width or period of
the Pulse signal. You can also try out different types of triggers, such
as a pulse width trigger.
Stabilize a Steady-State Periodic Signal
Using a trigger can stabilize the display of a periodic steady-state signal that you want to view and analyze. Because the trigger event is always in the stable position in the plot, a streaming periodic signal can appear still in the plot, rather than shifting or scrolling. When the display is stable, you can inspect and analyze signal characteristics, such as frequency and amplitude.
To see how a trigger can stabilize the display of a periodic signal, trigger display
updates using the Sine Wave signal. Use the same settings to configure
the rising-edge trigger in normal mode with a level of 0.5.
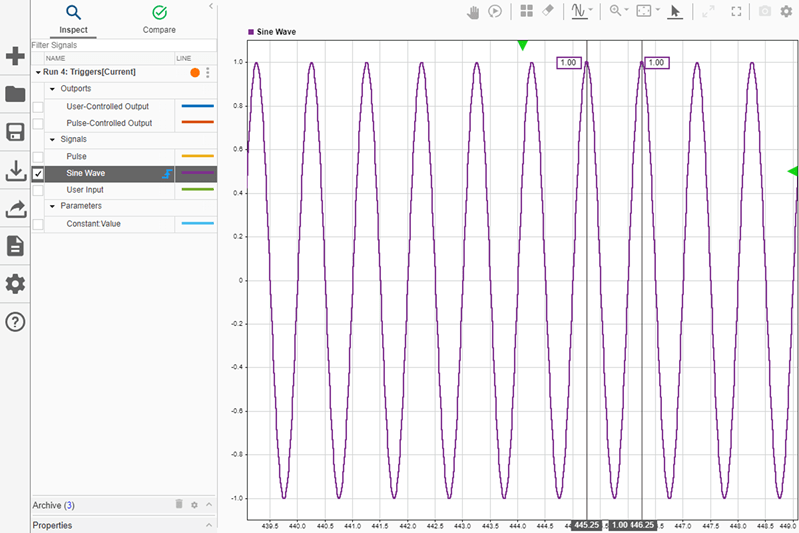
Before simulation, update the plot layout to show a single plot. Plot the Sine
Wave signal, and set the Time span to
10.
Simulate the model. During simulation, you can add cursors in the Simulation Data Inspector and measure the amplitude and period of the signal.
To contrast, remove the trigger and simulate the model again. Notice the differences in
how the display updates. Try simulating with the Update mode set to
Wrap and then set to Scroll. Specify
Update mode in Visualization Settings ![]() .
.