Iterate Model Design Using the Simulation Data Inspector
The Simulation Data Inspector facilitates iterative design, debugging, and optimization by providing easy access to visualizations of logged data during simulation. Using the Simulation Data Inspector archive, you can maintain a focused work area and control data retention for multiple simulations. When you automatically archive simulation runs, you can create a view that is automatically applied to subsequent simulation runs. With Browse Mode enabled, you can inspect large amounts of logged signals on Time Plot visualizations more quickly.
View and Inspect Signals During Simulation
You can plot logged signals in the Simulation Data Inspector during simulation. Viewing signals during a simulation can help build understanding of the model and allow you to make decisions about model parameters without waiting for a simulation to complete.
When you plot data that is streaming from an active simulation, the Simulation Data
Inspector automatically updates the time span of the plot to match the stop time for the
simulation. To view the streaming data on a smaller time scale, change the
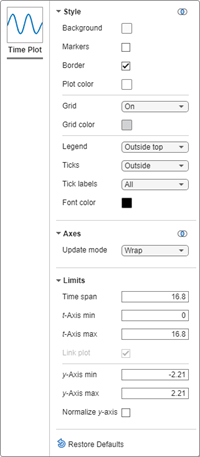
t-Axis max value or zoom in time. To update
the t-Axis max, open the Visualization
Settings
![]() . To zoom in time, select the Zoom in
Time option from the Zoom menu and click and drag in the
plot area to specify the time span.
. To zoom in time, select the Zoom in
Time option from the Zoom menu and click and drag in the
plot area to specify the time span.
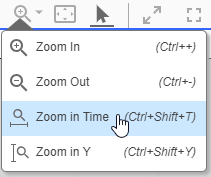
Use the Update mode setting to specify whether the Simulation Data Inspector wraps or scrolls the plot after the streaming data reaches the maximum time you specified.
To closely examine signals throughout design iteration, add data cursors to your plots.
You can add a data cursor to the plot during simulation, while a simulation is paused, or
after the simulation has finished. To add a data cursor, click the cursor button
![]() . Drag the data cursor across the plot to inspect signal
values. When you display multiple signals on a plot, the data cursor indicates the value for
each signal in a color-coded box.
. Drag the data cursor across the plot to inspect signal
values. When you display multiple signals on a plot, the data cursor indicates the value for
each signal in a color-coded box.
Click the drop-down on the cursors button and select Two Cursors to add a second data cursor and explore temporal characteristics of your data. You can move each cursor independently, or you can move them together. The number between the two cursors displays the time difference between the cursors.
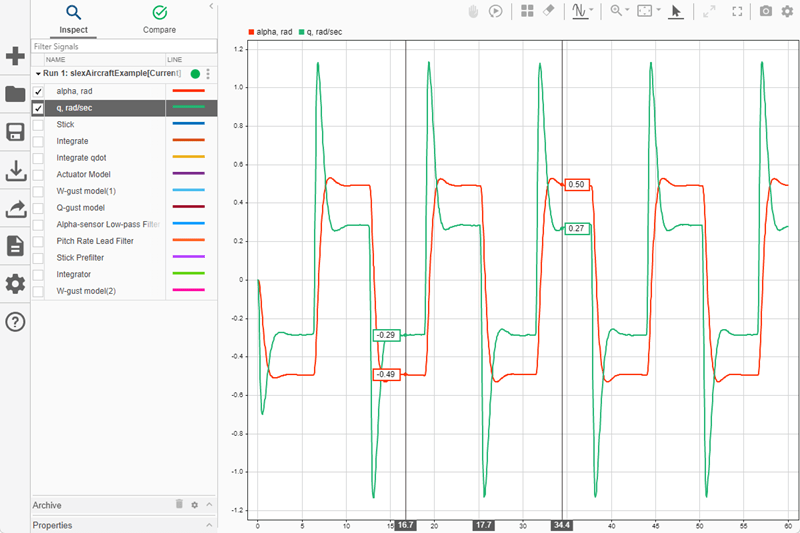
You can type directly into the box to specify a desired cursor separation. To move the cursors together, click and hold the middle number indicator, and drag it across the graphical viewing area to your desired position. For more information about using data cursors, see Inspect Simulation Data.
Automatically Transfer View to Current Simulation
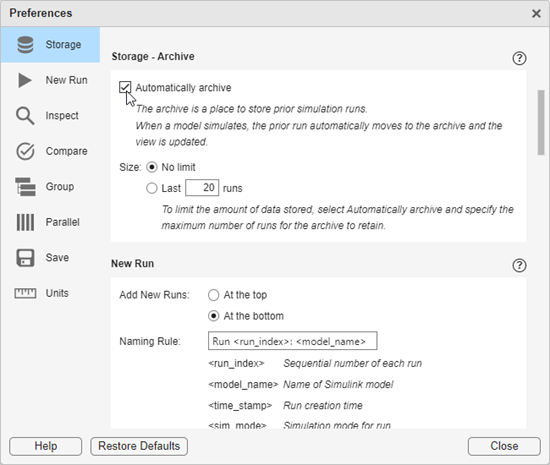
By default, the Simulation Data Inspector is configured to automatically archive
simulation runs and transfer a view from the previous run to the current simulation. When
you run a new simulation, the Simulation Data Inspector moves the prior simulation run to
the archive and updates the view to show aligned signals from the current run. You can
control archiving by toggling the Automatically archive setting. Click
Preferences ![]() . Then, navigate to the Storage -
Archive pane.
. Then, navigate to the Storage -
Archive pane.
For example, open the Model Fault-Tolerant Fuel Control System example model
sldemo_fuelsys.
openExample('simulink_automotive/ModelingAFaultTolerantFuelControlSystemExample')
sldemo_fuelsyssldemo_fuelsys model. Then, simulate the
sldemo_fuelsys model again. The signals from the previous run clear
from the plots, and the Simulation Data Inspector plots data from the current simulation as
the simulation runs. The previous run also moves into the archive, reducing clutter in the
work area.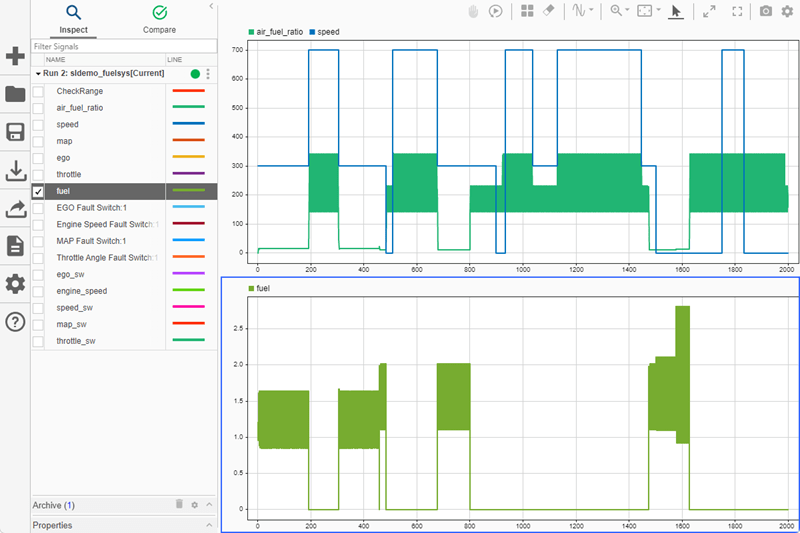
You can access and plot data from previous runs from within the archive, and you can drag runs of interest into the work area from the archive.
Control Data Retention
Running many simulations with logged signals can create a lot of data, especially during
iterative design and debugging workflows. To limit the amount of disk space occupied by
logged data, you can limit the amount of data the Simulation Data Inspector stores in the
archive from the Storage - Archive pane in the Preferences
![]() menu.
menu.

By default, the Simulation Data Inspector does not limit the number of runs stored in the archive. To impose a limit, select the Last runs radio button, and specify the desired limit. When the number of runs in the archive reaches the limit, the Simulation Data Inspector deletes the run that has been in the archive the longest. If the archive contains more runs than the limit you specify, the Simulation Data Inspector provides a warning before deleting your run data.
Tip
When you do not want the Simulation Data Inspector to store run data, specify an
archive limit of 0. With an archive limit of 0 and
Automatically archive enabled, the Simulation Data Inspector
automatically transfers your configured view to the current simulation and only retains
the current simulation data.
Visualize Many Logged Signals
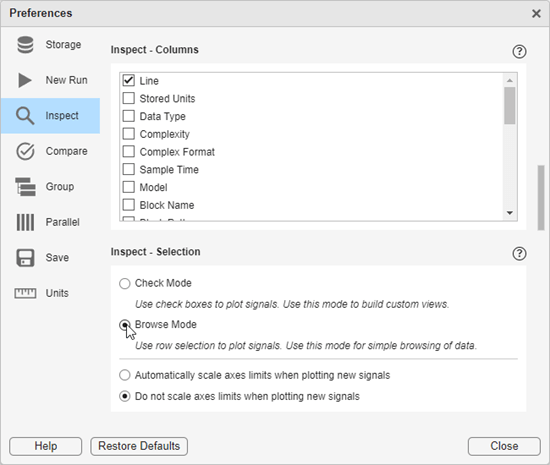
You can use Browse Mode to inspect many signals quickly on
Time Plot visualizations. To enable Browse Mode,
click Preferences ![]() . Then, select the Browse Mode radio
button from the Inspect - Selection pane.
. Then, select the Browse Mode radio
button from the Inspect - Selection pane.
Note
To use Browse Mode, all subplots, including hidden subplots, must be Time Plot visualizations.
In Browse Mode, signals selected in the navigation pane are plotted on the active Time Plot. You can use the arrow keys on your keyboard to change the selected signals, and you can select multiple signals by holding the Shift or Ctrl keys. When you select a row for a run or hierarchical organization, no signals are displayed in the graphical viewing area.
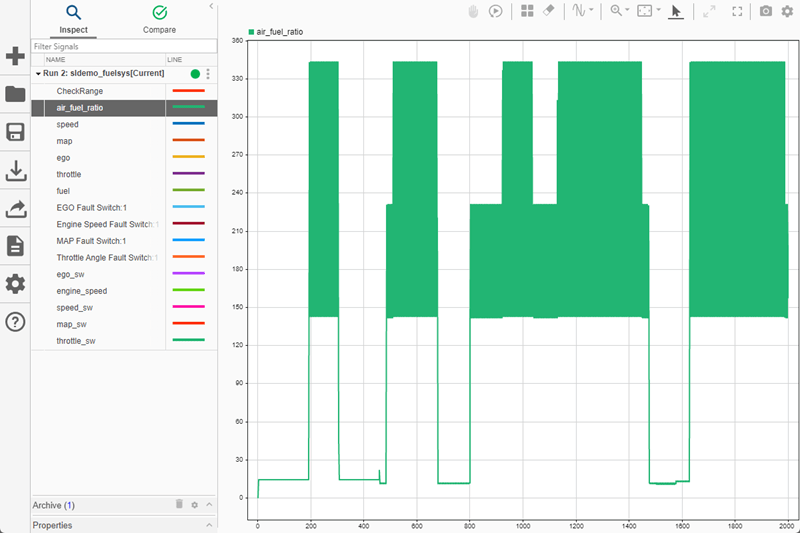
You can also use plot layouts in Browse Mode to make more complex visualizations. When the graphical viewing area contains multiple subplots, selecting new signals using the mouse or keyboard changes only the active plot.
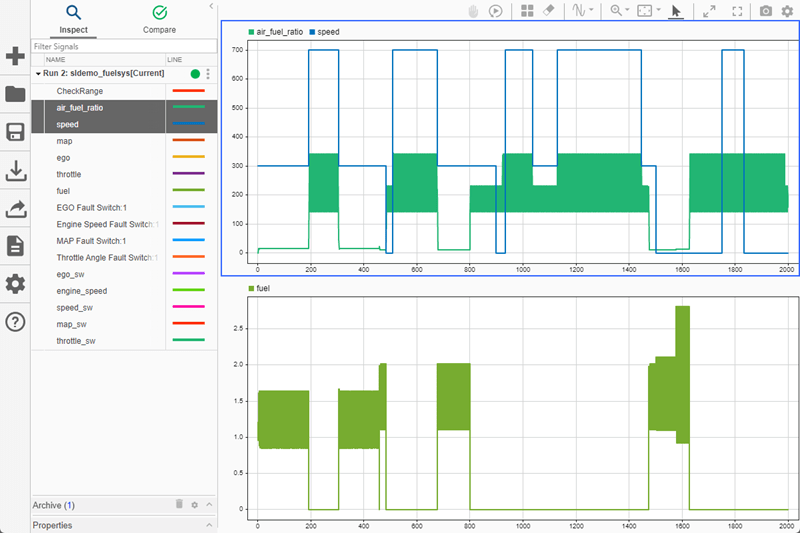
To preserve axes limits when new signals are plotted, select Do not scale
axes limits when plotting new signals from the Inspect -
Selection pane of the Preferences menu ![]() .
.
When you finish browsing your simulation results, enable Check Mode
from the Inspect - Selection pane of the Preferences menu
![]() . For more information about creating plots with the
Simulation Data Inspector, see Create Plots Using the Simulation Data Inspector.
. For more information about creating plots with the
Simulation Data Inspector, see Create Plots Using the Simulation Data Inspector.