Inspect Simulation Data
You can use the Simulation Data Inspector to view and inspect signals from simulations or imported data. The Simulation Data Inspector provides a comprehensive view of your data by allowing you to arrange data from multiple simulations and sources on multiple subplots. You can zoom and pan within plots and use data cursors for close examination of signal values, and you can replay data to analyze signal relationships.
This example shows you how to view and inspect signal data from the model
slexAircraftExample using the Simulation Data Inspector.
Configure Signals for Logging
This example uses signal logging to send data to the Simulation Data Inspector. You can also import signal data from the base workspace or a CSV, MDF, Microsoft® Excel®, or MAT file. For more information, see View Simulation Data in Simulation Data Inspector.
Open the model slexAircraftExample, mark several signals for logging,
and run a simulation.
Open the model.
openExample("simulink_aerospace/AircraftLongitudinalFlightControlExample")To log the
q, rad/sec, theStick, and thealpha, radsignals using signal logging, select the signals in the model. Then, click Log Signals.The logging badge
 appears above each signal marked for logging.
Double-click the Pilot block. Set Wave form to
sine. Click OK.On the Simulation tab, click Data Inspector to open the Simulation Data Inspector.
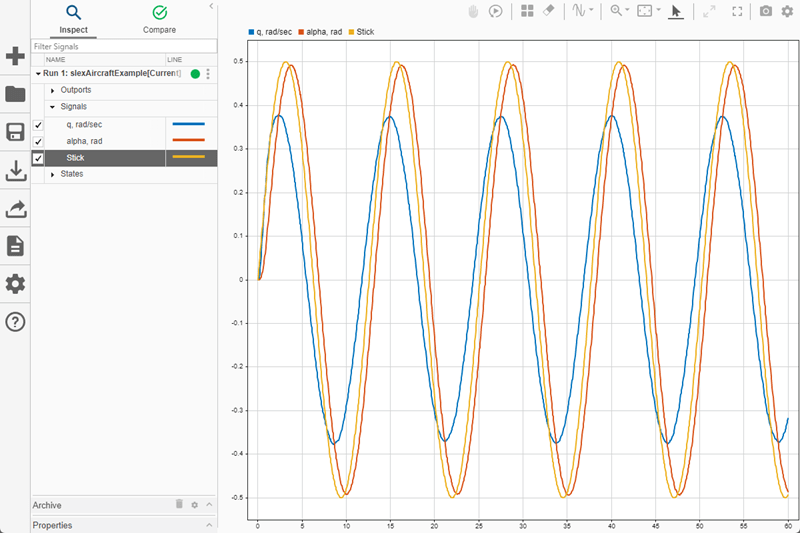
Simulate the model. The simulation run appears in the Simulation Data Inspector.
By default, the signal table on the Inspect pane lists all logged signals in rows, organized by simulation run. You can expand or collapse any of the runs to view the signals in a run. For more information on signal grouping, see Configure Simulation Data Inspector.
View Signals
To select signals you want to plot, use the check boxes next to the signals in the
table. Select the check boxes next to the q, rad/sec,
Stick, and alpha, rad signals. When the signal you
want to plot is easier to find in the model, you can click the logging badge for the signal
to plot it in the Simulation Data Inspector.
You can also use Browse Mode to quickly view all the signals in a run on time plots. For more information, see Visualize Many Logged Signals.
View Signals on Multiple Plots
You can use subplot layouts to view groups of signals on different subplots. For example, you can arrange the same signal from different simulation runs on the same subplot or view signals that have a similar range of values.
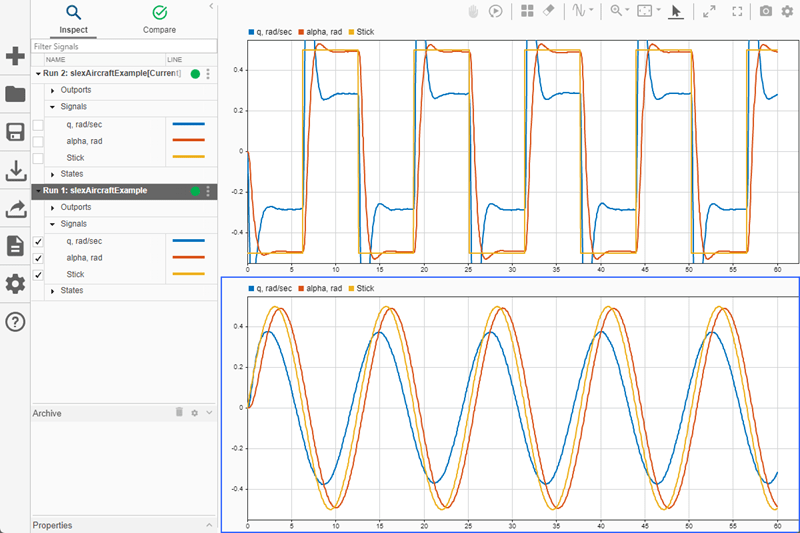
In the model, double-click the Pilot block. Set Wave form to
square. Click OK.Simulate the model.
By default, the Simulation Data Inspector automatically moves prior runs into the archive and transfers the view to the current run. Drag
Run 1from the archive into the work area.
Click Visualizations and layouts
 and select the
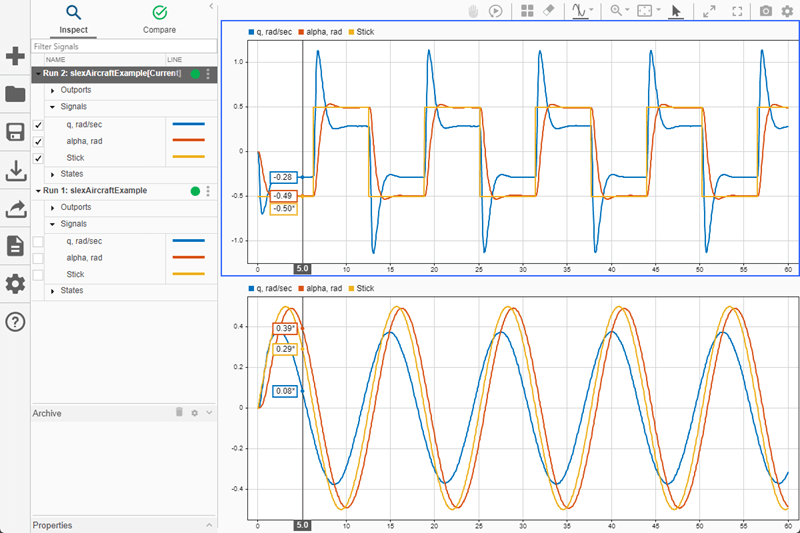
 2×1plot layout.Click the lower subplot. In the signal table, select the check boxes for the
q, rad/sec,Stick, andalpha, radsignals underRun 1.The check boxes in the signal table indicate the signals plotted in the selected subplot, outlined in blue.
You can also move signals graphically rather than using the check boxes. Drag the signal from the signal table or another subplot to the subplot where you want to plot it.
For more information on working with plots, see Create Plots Using the Simulation Data Inspector.
Zoom, Pan, and Resize Plots
You can closely inspect signals in a larger viewing area by maximizing a subplot or expanding the view to full screen.
 — Select Maximize to expand the active subplot to
occupy the entire graphical viewing area.
— Select Maximize to expand the active subplot to
occupy the entire graphical viewing area. — Select Full Screen to view your entire layout using your whole screen. The
Simulation Data Inspector automatically collapses the navigation pane so the view of
the layout is as large as possible.
— Select Full Screen to view your entire layout using your whole screen. The
Simulation Data Inspector automatically collapses the navigation pane so the view of
the layout is as large as possible.
You can zoom and pan within subplots that use a time plot visualization to inspect
signal values and the relationships between signals. You can access the zoom and pan
controls from the toolbar above the plots or from the subplot menu. Each icon allows you to
control aspects of the plot using your mouse ![]() .
.
You can select the action for the zoom button from the drop-down list.
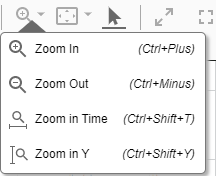
 When you want to zoom in on a selected area in the
plot, select Zoom In. While you have Zoom
In selected, the Simulation Data Inspector adapts the zoom action it
performs based on the area of the plot you select. To zoom only in the
y dimension, drag vertically. When you drag horizontally, the
Simulation Data Inspector zooms only in the t dimension. You
can also click and drag to zoom in on a rectangular region.
When you want to zoom in on a selected area in the
plot, select Zoom In. While you have Zoom
In selected, the Simulation Data Inspector adapts the zoom action it
performs based on the area of the plot you select. To zoom only in the
y dimension, drag vertically. When you drag horizontally, the
Simulation Data Inspector zooms only in the t dimension. You
can also click and drag to zoom in on a rectangular region.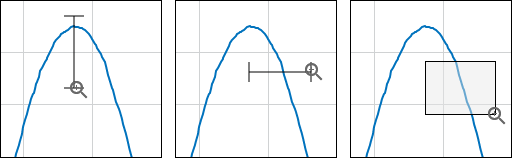
You can click the graphical viewing area to zoom in a fixed amount on both axes. Scrolling with the mouse wheel zooms in and out on both axes.
 Select Zoom Out to zoom out
a fixed amount from the center of the subplot when you click inside the graphical
viewing area. You can also use Zoom Out to undo a previous
Zoom In operation.
Select Zoom Out to zoom out
a fixed amount from the center of the subplot when you click inside the graphical
viewing area. You can also use Zoom Out to undo a previous
Zoom In operation. Select Zoom in Time to make
all mouse actions zoom on the t-axis. You can click the
graphical viewing area to zoom in a fixed amount. You can click and drag the
graphical viewing area to select a portion of the plot as the limits for the
t-axis. Scrolling with the mouse wheel zooms in and out on
the t-axis.
Select Zoom in Time to make
all mouse actions zoom on the t-axis. You can click the
graphical viewing area to zoom in a fixed amount. You can click and drag the
graphical viewing area to select a portion of the plot as the limits for the
t-axis. Scrolling with the mouse wheel zooms in and out on
the t-axis. Select Zoom in Y to make all
mouse actions zoom on the y-axis. You can click in the
graphical viewing area to zoom in a fixed amount. You can also click and drag to
select a portion of the plot as the limits for the y-axis.
Scrolling with the mouse wheel zooms in and out on the
y-axis.
Select Zoom in Y to make all
mouse actions zoom on the y-axis. You can click in the
graphical viewing area to zoom in a fixed amount. You can also click and drag to
select a portion of the plot as the limits for the y-axis.
Scrolling with the mouse wheel zooms in and out on the
y-axis.
 With the mouse pointer selected, you can select
signals by clicking them. Pan by clicking anywhere on the plot and dragging the
mouse.
With the mouse pointer selected, you can select
signals by clicking them. Pan by clicking anywhere on the plot and dragging the
mouse.You can select the fit action to scale the axes.

 Select Fit to View to scale
both the y and time axes to accommodate your plotted
data.
Select Fit to View to scale
both the y and time axes to accommodate your plotted
data. Select Fit to View in Time
to scale the t-axis to fit your data.
Select Fit to View in Time
to scale the t-axis to fit your data. Select Fit to View in Y to
scale the y-axis to fit your data.
Select Fit to View in Y to
scale the y-axis to fit your data.
Linked Subplots
Subplots are linked by default. Linked plots have a synchronized response when you perform actions that change the time axis, including:
Any pan operation involving the t-axis
Any zoom operation involving the t-axis
Any fit to view operation involving the t-axis
Any adjustment to the t-axis limits
To inspect data independently in a subplot, you can unlink the subplot.
Select the subplot you want to unlink.
Click the Visualization Settings button in the upper right of the viewing area.
In the Limits section, clear the Link plot option. The broken link symbol
 appears on the unlinked subplot.
Inspect Simulation Data Using Cursors
In the Simulation Data Inspector, you can inspect signals using data cursors. You can use one or two cursors to inspect your data. To add two cursors, select Two Cursors from the Show/hide data cursors drop-down list.

With two cursors, three time values are displayed: the times that corresponded to each cursor position and the time spanned by the cursors. You can move the two cursors together by dragging the span label between the two cursors. You can also set the span by typing the desired value into the label field.

Practice inspecting data with cursors using one cursor.
Select One Cursor from the Show/hide data cursors drop-down list
 .
. 
Drag the data cursor left or right to a point of interest. You can also use the arrow keys to move the data cursor from sample to sample.
To inspect the data at a specific point in time, click the cursor time field and enter the desired time value, for example,
35.5.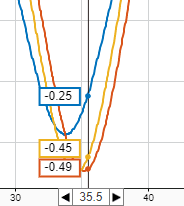
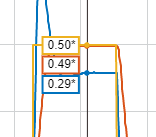
If the signal does not have a sample at the point of interest, the Simulation Data Inspector interpolates the value for the indicated time. An asterisk in the data cursor label indicates that the displayed value is interpolated. For information regarding interpolation methods, see Interpolation.
When you have finished inspecting the data, click Show/hide data cursors
to remove the cursor from the viewing area.
Replay Data
You can replay data in the Simulation Data Inspector to inspect signal value changes and
relationships between signals. Replaying data in the Simulation Data Inspector has no effect
on any models or simulations. To replay data, first show the replay controls by clicking
Show/hide replay controls ![]() . Then, press Replay
. Then, press Replay ![]() .
.
The Simulation Data Inspector synchronously sweeps a cursor displaying the signal value across all subplots in the view. By default, data replays at a rate of one second per second, which means that replaying one second of data takes one second of clock time. You can adjust the replay speed using the arrows on either side of the label or by clicking the label to type the desired speed. You can also pause the replay and use the step forward and step backward buttons to inspect signal values sample by sample. For a detailed example, see Replay Data in the Simulation Data Inspector.
