Spectrum Analyzer Cursor Measurements Panel
The Cursor Measurements panel displays screen cursors. The panel provides two types of cursors for measuring signals. Waveform cursors are vertical cursors that track along the signal. Screen cursors are both horizontal and vertical cursors that you can place anywhere in the display.
Note
If a data point in your signal has more than one value, the cursor measurement at that point is undefined and no cursor value is displayed.
In the Scope menu, select Tools > Measurements > Cursor Measurements. Alternatively, in the Scope toolbar, click the Cursor Measurements
![]() button.
button.
The Cursor Measurements panel for the spectrum and dual view:

The Cursor Measurements panel for the spectrogram view. You must pause the spectrogram display before you can use cursors.

You can use the mouse or the left and right arrow keys to move vertical or waveform cursors and the up and down arrow keys for horizontal cursors.
To access the cursor settings, click the drop-down arrow under Data Cursors and click Cursor Settings. In the settings, you can select to display horizontal or vertical cursors, specify the position of the cursors, lock the spacing between the cursors, show the cursors panel and measurements. When more than one signal is displayed, you can assign cursors to trace each signal individually.
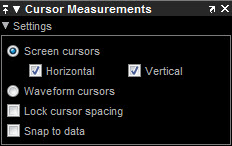
Horizontal –– Select to display horizontal screen cursors. Enabled only when you display the Screen Cursors.
Vertical –– Select to display vertical screen cursors. Enabled only when you display the Screen Cursors.
Snap to Data — Positions the cursors on signal data points.
Lock Cursor Spacing — Locks the frequency difference between the two cursors.
Show Panel — Show the cursor measurements panel at the bottom of the display.
Show Measurement — Show the Δsecs and ΔValue cursor measurements on the signal display.
The Measurements pane displays the frequency (Hz) , time (s), and power (dBm) value measurements. Time is displayed only in spectrogram mode. Channel Power shows the total power between the cursors.
1 — Shows or enables you to modify the frequency, time (for spectrograms only), or both, at cursor number one.
2 — Shows or enables you to modify the frequency, time (for spectrograms only), or both, at cursor number two.
Δ — Shows the absolute value of the difference in the frequency, time (for spectrograms only), or both, and power between cursor number one and cursor number two.
Channel Power — Shows the total power in the channel defined by the cursors.
The letter after the value associated with a measurement indicates the abbreviation for the appropriate International System of Units (SI) prefix.