Ejecución en MATLAB
Diseñe la lógica utilizando gráficos de estados y ejecute dicha lógica como programas de MATLAB. Ejecute el gráfico y realice una prueba unitaria en el editor de Stateflow. Controle el comportamiento de las interfaces de usuario y las aplicaciones de procesamiento de datos a través del gráfico.
Funciones
Sintaxis de Stateflow
Temas
- Create Stateflow Charts for Execution as MATLAB Objects
Save standalone Stateflow charts outside of Simulink® models.
- Execute and Unit Test Stateflow Chart Objects
Run Stateflow charts in MATLAB or through the Stateflow Editor.
- Ejecutar los objetos de un gráfico de Stateflow mediante scripts y modelos
Cree un script de MATLAB o un modelo de Simulink que invoque un gráfico independiente de Stateflow.
- Convertir código de MATLAB en diagramas de flujo de Stateflow
Cree diagramas de flujo a partir de código de MATLAB.
Solución de problemas
Debug a Standalone Stateflow Chart
Interrupt execution to step through each action in a Stateflow chart.
Información relacionada
Ejemplos destacados

Diseñar una lógica de interfaz persona-máquina utilizando gráficos de Stateflow
Modelice la lógica de una app de lámpara en un gráfico de Stateflow independiente.

Model a Communications Protocol by Using Chart Objects
Use a standalone Stateflow® chart to model a frame-synchronization and symbol-detection component in a communications system. Standalone charts implement classic chart semantics with MATLAB® as the action language. You can program the chart by using the full functionality of MATLAB, including those functions that are restricted for code generation in Simulink®. For more information, see Create Stateflow Charts for Execution as MATLAB Objects.

Implement a Financial Strategy by Using Stateflow
Use a standalone Stateflow® chart to model a financial trading strategy known as Bollinger Bands. Standalone charts implement classic chart semantics with MATLAB® as the action language. You can program the chart by using the full functionality of MATLAB, including those functions that are restricted for code generation in Simulink®. For more information, see Create Stateflow Charts for Execution as MATLAB Objects.

Model a Fitness App by Using Standalone Charts
Implement a fitness tracker by using multiple standalone charts and a MATLAB app.

Model Bluetooth Low Energy Link Layer Using Stateflow
Use a standalone Stateflow chart to model the state machine in a Bluetooth® low energy link layer.
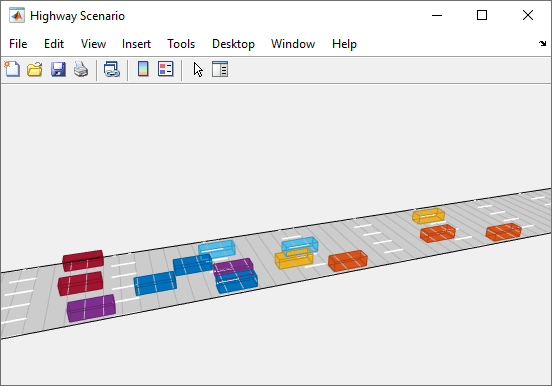
Automatizar el control de vehículos inteligentes usando gráficos de Stateflow
Modele un escenario de conducción con vehículos inteligentes controlados por la misma lógica de decisión.
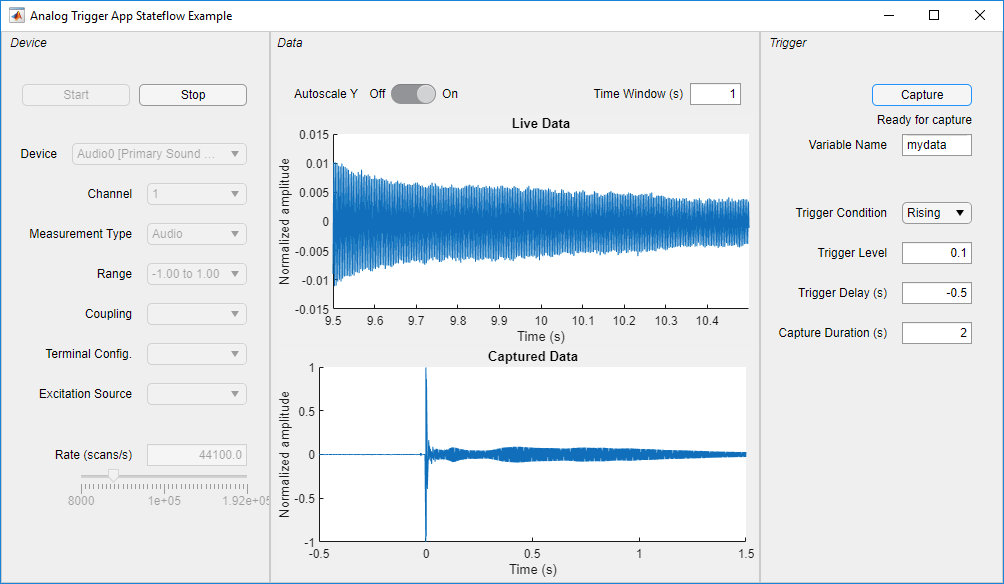
Analog Triggered Data Acquisition Using Stateflow Charts
Create an analog-triggered data acquisition app by using Stateflow, Data Acquisition Toolbox™, and App Designer.

Flujo de trabajo de pick-and-place con Stateflow para MATLAB
Diseñe un flujo de trabajo de pick-and-place para un manipulador robótico como Kinova® Gen3 con Stateflow.