Crear y ejecutar un gráfico de Stateflow
Un gráfico de Stateflow® es una representación gráfica de una máquina de estado finito compuesta por estados, transiciones y datos. Puede crear un gráfico de Stateflow para definir cómo reacciona un sistema a las señales de entrada externas, los eventos y las condiciones basadas en el tiempo.
Por ejemplo, este gráfico de Stateflow presenta la lógica que subyace a un rectificador de media onda. El gráfico contiene dos estados con las etiquetas On y Off. En el estado On, la señal de salida del gráfico y es igual a la entrada x. En el estado Off, la señal de salida se establece en cero. Cuando la señal de entrada cruza cierto umbral t0, el gráfico cambia entre estos estados. Las acciones de cada estado actualizan el valor de y en cada unidad de tiempo de la simulación.
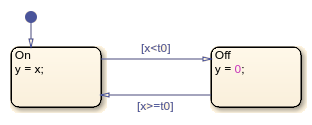
Este ejemplo muestra cómo crear y simular este gráfico de Stateflow.
Crear el gráfico de Stateflow
Abrir el editor de Stateflow
El editor de Stateflow es un entorno gráfico para diseñar diagramas de transición de estado, diagramas de flujo, tablas de transición de estado y tablas de verdad.
Para abrir un nuevo modelo de Simulink que contenga un gráfico de Stateflow, en la ventana de comandos de MATLAB, utilice la función
sfnew:sfnew rectifySimulink® crea un modelo llamado
rectifyque contiene un bloque Chart de Stateflow vacío.Para abrir el editor de Stateflow, haga doble clic en el bloque del gráfico.
Los componentes principales del Editor de Stateflow son el área de diseño del gráfico, la paleta de objetos y el panel Symbols.
El área de diseño del gráfico es un área de representación donde se crea un gráfico combinando estados, transiciones y otros elementos gráficos.
En la parte izquierda del área de diseño, la paleta de objetos muestra un conjunto de herramientas para añadir elementos gráficos al gráfico.
En la parte derecha del área de diseño, en el panel Symbols, se añaden datos, eventos y mensajes nuevos al gráfico y se resuelve cualquier símbolo sin definir o sin usar.

Añadir estados y transiciones
Desde la paleta de objetos, haga clic en el icono State
 y mueva el puntero al área de diseño del gráfico. Aparece un estado con su transición predeterminada. Para colocar el estado, haga clic en un punto del área de diseño. En el comando de texto, introduzca el nombre de estado
 Ony la acción de estadoy = x.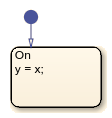
Añada otro estado. Haga clic con el botón secundario y arrastre el estado
On. Las indicaciones gráficas azules ayudan a alinear los estados horizontal o verticalmente. El nombre del estado nuevo cambia aOff. Haga doble clic en el estado y cambie la acción de estado ay = 0.
Vuelva a alinear los dos estados y deténgase en el espacio entre los dos estados. Las indicaciones de transición azules indican diferentes formas para conectar los estados. Para añadir transiciones, haga clic en el indicador adecuado.
De forma alternativa, para representar una transición, haga clic en el flanco de un estado y arrástrelo al flanco del otro estado.
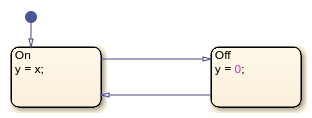
Haga doble clic en cada transición y escriba la condición de transición adecuada
x<t0ox>=t0. Las condiciones aparecen entre corchetes.
Depure el gráfico:
Para mejorar la claridad, mueva cada etiqueta de transición a una ubicación adecuada encima o debajo de la transición correspondiente.
Para alinear y cambiar el tamaño de los elementos gráficos del gráfico, en la pestaña Format haga clic en Auto Arrange o presione Ctrl+Shift+A.
Para cambiar el tamaño del gráfico de modo que quepa en el área de diseño, presione la barra espaciadora o haga clic en el icono Fit To View
 .
.
Resolver símbolos no definidos
Antes de poder ejecutar el gráfico, debe definir cada símbolo que se usa en el gráfico y especificar su alcance (por ejemplo, datos de entrada, datos de salida o datos locales).
En la pestaña Modeling, en Design Data, seleccione Symbols Pane.
En el panel de Symbols, los símbolos no definidos están marcados con un distintivo de error rojo
 .
.En el panel Symbols, haga clic en Resolve Undefined Symbols
 . La columna Type muestra el alcance sugerido de cada símbolo no definido basándose en su uso en el gráfico. El editor de Stateflow resuelve los símbolos
 xyt0como datos de entrada e
e ycomo datos de salida .
.
Dado que el umbral
t0no cambia durante la simulación, cambie su alcance a datos constantes. En la columna Type, haga clic en el icono de tipo de datos situado junto at0y seleccione
Constant Data.Establezca el valor del umbral en
t0. En la columna Value, haga clic en la entrada vacía situada junto at0e introduzca un valor de 0.Guarde el gráfico de Stateflow.
Simular el modelo
Para simular el modelo de Simulink, conecte el bloque del gráfico con otros bloques del modelo a través de puertos de entrada y de salida.
Para volver al editor de Simulink, en la barra de navegación en la parte superior del área de diseño, haga clic en el nombre del modelo de Simulink:

rectify. Si la barra de navegación no está visible, haga clic en el icono Hide/Show Explorer Bar en la parte superior de la paleta de objetos.
Añada una fuente al modelo:
Desde la biblioteca Sources de Simulink, añada un bloque Sine Wave (Simulink).
Haga doble clic en el bloque Sine Wave y establezca Sample time en 0.2.
Conecte la salida del bloque Sine Wave con la entrada del gráfico de Stateflow.
Etiquete la señal como
x.
Añada un sumidero al modelo:
Desde la biblioteca Sinks de Simulink, añada un bloque Scope (Simulink) con dos puertos de entrada.
Conecte la salida del bloque Sine Wave con la primera entrada del bloque Scope.
Conecte la salida del gráfico de Stateflow con la segunda entrada del bloque Scope.
Etiquete la señal como
y.
Guarde el modelo de Simulink.
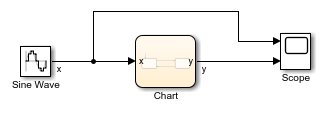
Para simular el modelo, haga clic en Run
 . Durante la simulación, el editor de Stateflow resalta los estados activos y las transiciones mediante la animación del gráfico.
Después de simular el modelo, haga doble clic en el bloque Scope. El bloque Scope muestra los gráficos de las señales de entrada y salida a los gráficos.
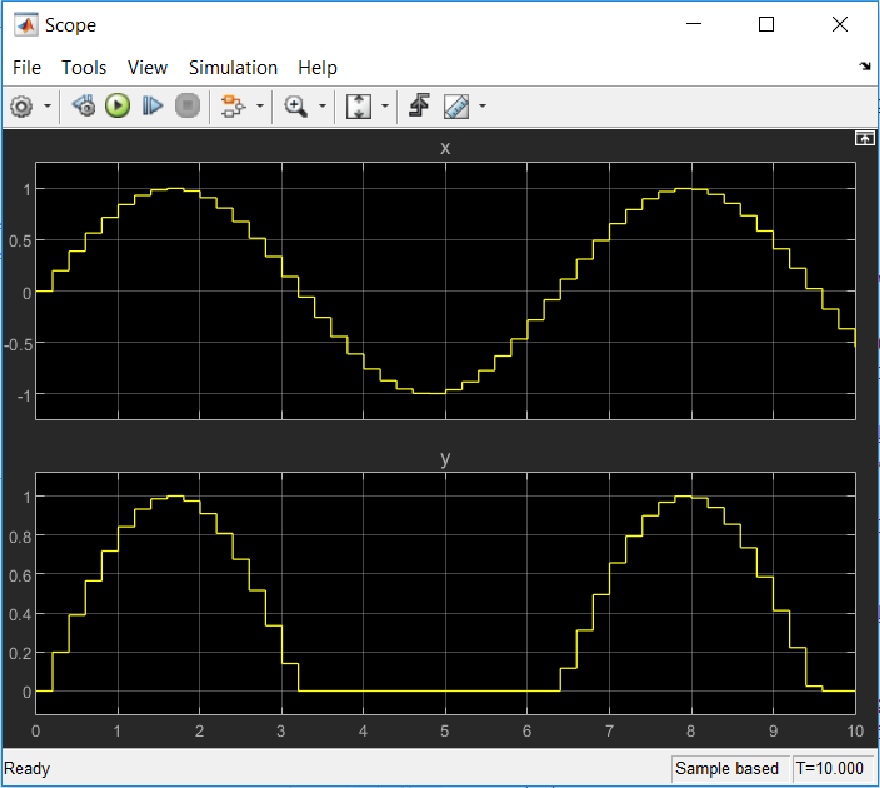
Los resultados de la simulación muestran que el rectificador filtra valores de entrada negativos.