insertObjectAnnotation
Annotate truecolor or grayscale image or video
Syntax
Description
___ = insertObjectAnnotation(___,
specifies options using one or more name-value arguments in addition to the previous
syntax. For example, Name=Value)FontSize=18 sets the annotation font size to
18.
Examples
Read an image into the workspace.
I = imread("board.tif");Create confidence value labels using floating point numbers.
label_str = cell(3,1);
conf_val = [85.212 98.76 78.342];
for ii = 1:3
    label_str{ii} = ['Confidence: ' num2str(conf_val(ii), '%0.2f') '%'];
end
Set the positions for the rectangular bounding boxes associated with the labels using the form [x y width height].
position = [23 373 60 66; 35 185 77 81; 77 107 59 26];
Insert the labels into the image.
RGB = insertObjectAnnotation(I,"rectangle",position,label_str,TextBoxOpacity=0.9,FontSize=18);Display the annotated image.
figure
imshow(RGB)
title("Annotated chips")
Read an image into the workspace.
I = imread("coins.png");Set the positions on the image for the circular bounding boxes associated with the labels. The first two values of each row specify the center coordinates of a circle, (x,y) and the third value is the radius.
position = [96 146 31; 236 173 26];
Set the values for the labels to display as 5 and 10, in integers. These values represent US currency in the form of a nickle and dime, respectively.
label = [5 10];
Insert the annotations into the image.
RGB = insertObjectAnnotation(I,"circle",position,label,LineWidth=3,AnnotationColor=["cyan","yellow"],FontColor="black");
Display the annotated image.
figure
imshow(RGB)
title("Annotated Coins")
Input Arguments
Input image, specified as an M-by-N-by-3 truecolor or an M-by-N grayscale image.
Data Types: single | double | int16 | uint8 | uint16
Shape of the annotation, specified as "rectangle",
"circle", "projected-cuboid", or
"ellipse". If you specify a "rectangle"
annotation be specify the position of either an axis-aligned or rotated
rectangle.
Data Types: char | string
Position of the shape, specified according to the type of shape, as described in the table.
| Shape | Position | Definition |
|---|---|---|
| For one or more axis-aligned rectangles or filled rectangles, specify as an M-by-4 numeric matrix, where each row specifies a rectangle of the form .
| |
|
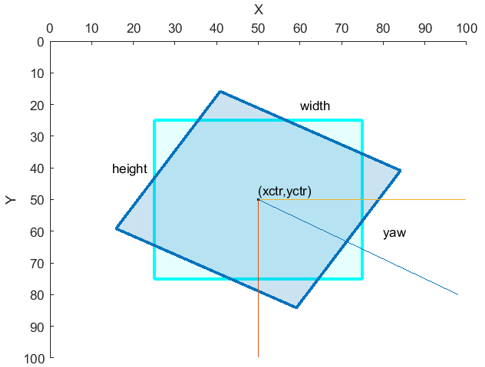
For one or more rotated rectangles, specify in spatial coordinates as an M-by-5 numeric matrix, where each row specifies a rotated rectangle of the form [xctr yctr w h yaw].
|  | |
| For one or more circles, specify spatial coordinates as an M-by-3 numeric matrix, where each row specifies a circle of the form [xctr yctr radius].
| |
ellipse | For one or more ellipses, specify in spatial coordinates as an M-by-5 matrix, where each row specifies an ellipse of the form [xctr yctr major minor yaw]
|
|
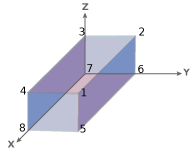
projected-cuboid | For one or more projected cuboids, specify in spatial coordinates as an 8-by-2-by-M array or an M-by-8 matrix, where M is the number of projected cuboids. When specified as an 8-by-2-by-M array, each row must contain the [x y] location of a projected cuboid vertex. The vertices connect to form a cuboid with six faces. The order of the input vertices must match the order shown in the diagram. When specified as an M-by-8 matrix, each row specifies the dimensions of the front-facing and rear-facing sides of a projected cuboid in the form, [x1 y1 w1 h1 x2 y2 w2 h2], where [x1 y1] and [x2 y2] specify the upper-left coordinates of the front-facing and rear-facing sides, respectively, and [w1 h1] and [w2 h2] specify the corresponding widths and heights. |
|
Data Types: single | double | cell | int8 | int16 | int32 | int64 | uint8 | uint16 | uint32 | uint64
Label to associate with a shape, specified as an M-element numeric vector, string array, vector of categorical labels, or a cell array of ASCII character vectors. If you use character vectors, string scalars, or categorical labels, you must encode them as ASCII characters. If you specify a cell array, it must be equal in length to the number of specified shape positions. You can specify a single label for all shapes using a numeric scalar, string scalar, or scalar categorical label.
Example: [5 10] marks the first shape with the label
5, and the second shape with the label
10.
Name-Value Arguments
Specify optional pairs of arguments as
Name1=Value1,...,NameN=ValueN, where Name is
the argument name and Value is the corresponding value.
Name-value arguments must appear after other arguments, but the order of the
pairs does not matter.
Example: insertObjectAnnotation(I,"rectangle",position,label,FontSize=18);
sets the font size to use for inserting annotations to 18.
Before R2021a, use commas to separate each name and value, and enclose
Name in quotes.
Example: insertObjectAnnotation(I,"rectangle",position,label,"FontSize","18");
sets the font size to use for inserting annotations to 18.
Font face of the label text, specified as a character vector or string scalar. The
font face must be one of the available truetype fonts installed on your system. To get
a list of available fonts on your system, use the listTrueTypeFonts function from the MATLAB® command prompt.
Data Types: char | string
Label text font size, specified as an integer that corresponds to points in the range of
[8 200].
Data Types: double | single | int8 | int16 | int32 | int64 | uint8 | uint16 | uint32 | uint64
Font color, specified as a short color name, color name, vector of color names, three-column matrix of RGB triplets.
The supported colors table lists RGB intensities in the range [0, 1], but you must
specify RGB triplets in the range of your selected data type. For example, if
specifying this argument as a matrix of uint8 values, you must
convert each intensity value to the range [0, 255]. To convert the listed intensity
values to a uint8 data type, use the code
uint8(255*intensity), where intensity is an RGB triplet value
listed in the table.
You can specify a different color for each font string or one color for all
strings. To specify one color for all strings, specify FontColor
as a color name or an [R
G
B] vector.
Data Types: logical | uint8 | uint16 | int16 | double | single
Annotation color, specified as a short color name, color name, vector of color names, three-column matrix of RGB triplets.
The supported colors table lists RGB intensities in the range [0, 1], but you must
specify RGB triplets in the range of your selected data type. For example, if
specifying this argument as a matrix of uint8 values, you must
convert each intensity value to the range [0, 255]. To convert the listed intensity
values to a uint8 data type, use the code
uint8(255*intensity), where intensity is an RGB triplet value
listed in the table.
You can specify a different color for each marker or one color for all markers. To
specify one color for all markers, specify AnnotationColor as a
color name or an [R
G
B] vector.
| Specification | Format | Example |
|---|---|---|
| Specify one color for all shapes (or markers) | Short color name or color name |
|
RGB triplet |
| |
| Specify a color for each shape (or marker) | Vector of color names |
|
Three-column matrix of RGB triplets | [1 0 0 0 1 1 1 0 1 1 1 1]  |
Supported colors are listed in the table.
| Color Name | Short Name | RGB Triplet | Appearance |
|---|---|---|---|
"red" | "r" | [1 0 0] |
|
"green" | "g" | [0 1 0] |
|
"blue" | "b" | [0 0 1] |
|
"cyan" | "c" | [0 1 1] |
|
"magenta" | "m" | [1 0 1] |
|
"yellow" | "y" | [1 1 0] |
|
"black" | "k" | [0 0 0] |
|
"white" | "w" | [1 1 1] |
|
Data Types: cell | char | uint8 | uint16 | int16 | double | single
Opacity of the text label box background, specified as a scalar in the range of [0,
1]. A value of 0 renders the background of the label
text box as fully transparent, while a value of 1 renders it as
fully opaque.
Data Types: double | single | int8 | int16 | int32 | int64 | uint8 | uint16 | uint32 | uint64
Shape border line width, specified as a positive integer, in pixels.
Original orientation indicator, specified as a numeric or logical
1 (true) or 0
(false). A value of 1
(true) displays the original orientation of the rotated rectangle
by using an arrow annotation on the bounding box. The original orientation is defined
as a zero rotation angle. A value of 0 (false)
does not show the arrow annotation.
This argument applies only when Shape describes a rotated
rectangle or an ellipse.
Data Types: logical | integer
Output Arguments
Output image, returned as an M-by-N-by-3 truecolor image.
Extended Capabilities
Usage notes and limitations:
Input image must be bounded. See Specify Upper Bounds for Variable-Size Arrays (MATLAB Coder).
Code generation requires a C++ compiler. For a list of supported compilers, see Supported and Compatible Compilers
Version History
Introduced in R2012bAdded support for "ellipse" to visualize one or more ellipses on top
of an image or on video data.
Starting in R2024b, the default value for the ShowOrientation
name-value argument will be false.
Starting in R2023b, you can specify marker color with RGB values in the range [0,1].
You can specify a rotated rectangle bounding box using the form [xctr yctr width height yaw].
You can now specify the ShowOrientation name-value argument to
display the orientation and angle of a rotated rectangle bounding box.
Added support to visualize projected cuboids.
See Also
Functions
MATLAB Command
You clicked a link that corresponds to this MATLAB command:
Run the command by entering it in the MATLAB Command Window. Web browsers do not support MATLAB commands.
Seleccione un país/idioma
Seleccione un país/idioma para obtener contenido traducido, si está disponible, y ver eventos y ofertas de productos y servicios locales. Según su ubicación geográfica, recomendamos que seleccione: .
También puede seleccionar uno de estos países/idiomas:
Cómo obtener el mejor rendimiento
Seleccione China (en idioma chino o inglés) para obtener el mejor rendimiento. Los sitios web de otros países no están optimizados para ser accedidos desde su ubicación geográfica.
América
- América Latina (Español)
- Canada (English)
- United States (English)
Europa
- Belgium (English)
- Denmark (English)
- Deutschland (Deutsch)
- España (Español)
- Finland (English)
- France (Français)
- Ireland (English)
- Italia (Italiano)
- Luxembourg (English)
- Netherlands (English)
- Norway (English)
- Österreich (Deutsch)
- Portugal (English)
- Sweden (English)
- Switzerland
- United Kingdom (English)

