insertShape
Insert shapes in image or video
Description
RGB = insertShape(___,Name=Value)LineWidth=5 sets the line width value to 5 of the
inserted shapes.
Examples
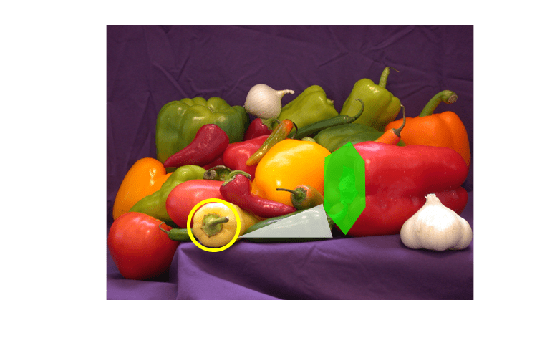
Read an image into the workspace.
I = imread("peppers.png");Place a circle on the image with a border line width of 5 pixels.
RGB = insertShape(I,"circle",[150 280 35],LineWidth=5);Place a filled triangle and a filled hexagon on the image.
pos_triangle = [183 297 302 250 316 297];
pos_hexagon = [340 163 305 186 303 257 334 294 362 255 361 191];
RGB = insertShape(RGB,"filled-polygon",{pos_triangle pos_hexagon}, ...
    ShapeColor=["white","green"],Opacity=0.7);
Display the resulting image.
imshow(RGB)
Input Arguments
Input image, specified as an M-by-N-by-3 truecolor or an M-by-N grayscale image.
Data Types: single | double | int16 | uint8 | uint16
Type of shape, specified as "rectangle",
"filled-rectangle", "line",
"polygon", "filled-polygon",
"circle", "filled-circle",
"projected-cuboid", "ellipse", or
"filled-ellipse".
Data Types: char | string
Position of shape, specified according to the type of shape, as described in the table.
| Shape | Position | Definition |
|---|---|---|
| For one or more axis-aligned rectangles or filled rectangles, specify as an M-by-4 numeric matrix, where each row specifies a rectangle of the form .
| |
|
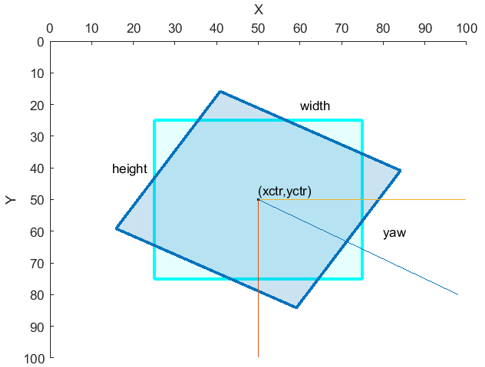
For one or more rotated rectangles, specify in spatial coordinates as an M-by-5 numeric matrix, where each row specifies a rotated rectangle of the form [xctr yctr w h yaw].
|  | |
| For one or more circles, specify spatial coordinates as an M-by-3 numeric matrix, where each row specifies a circle of the form [xctr yctr radius].
| |
| For one or more ellipses, specify in spatial coordinates as an M-by-5 matrix, where each row specifies an ellipse of the form [xctr yctr major minor yaw]
|
|
| For one or more lines, specify spatial coordinates using one of these formats to specify a single line with connected endpoints, multiple lines with the same number of endpoints, or multiple lines with different numbers of endpoints.
| |
| For one or more polygons, specify in spatial coordinates as an M-by-1 cell array, where each cell contains an L-by-2 matrix of [x y] vertex locations or a 1-by-2L vector of consecutive vertex locations of the form [x1, y1, x2,y2, … xL,yL ].
|
|
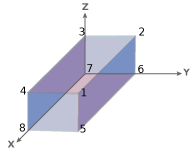
projected-cuboid | For one or more projected cuboids, specify in spatial coordinates as an 8-by-2-by-M array or an M-by-8 matrix, where M is the number of projected cuboids. When specified as an 8-by-2-by-M array, each row must contain the [x y] location of a projected cuboid vertex. The vertices connect to form a cuboid with six faces. The order of the input vertices must match the order shown in the diagram. When specified as an M-by-8 matrix, each row specifies the dimensions of the front-facing and rear-facing sides of a projected cuboid in the form, [x1 y1 w1 h1 x2 y2 w2 h2], where [x1 y1] and [x2 y2] specify the upper-left coordinates of the front-facing and rear-facing sides, respectively, and [w1 h1] and [w2 h2] specify the corresponding widths and heights. |
|
Data Types: single | double | cell | int8 | int16 | int32 | int64 | uint8 | uint16 | uint32 | uint64
Name-Value Arguments
Specify optional pairs of arguments as
Name1=Value1,...,NameN=ValueN, where Name is
the argument name and Value is the corresponding value.
Name-value arguments must appear after other arguments, but the order of the
pairs does not matter.
Example: insertShape(I,"circle",position,Color="yellow") sets the
shape color to yellow.
Before R2021a, use commas to separate each name and value, and enclose
Name in quotes.
Example: insertShape(I,"circle",position,"Color","yellow") sets the
shape color to yellow.
Shape border line width, specified as a positive integer, in pixels. This argument applies to
only the "Rectangle", "Line",
"Polygon", and "Circle" shapes.
Data Types: uint8 | uint16 | int16 | double | single
Shape color, specified as a short color name, color name, vector of color names, three-column matrix of RGB triplets.
The supported colors table lists RGB intensities in the range [0, 1], but you must
specify RGB triplets in the range of your selected data type. For example, if
specifying this argument as a matrix of uint8 values, you must
convert each intensity value to the range [0, 255]. To convert the listed intensity
values to a uint8 data type, use the code
uint8(255*intensity), where intensity is an RGB triplet value
listed in the table.
You can specify a different color for each shape or one color for all shapes. To
specify one color for all markers, specify ShapeColor as a color
name or an [R
G
B] vector.
| Specification | Format | Example |
|---|---|---|
| Specify one color for all shapes (or markers) | Short color name or color name |
|
RGB triplet |
| |
| Specify a color for each shape (or marker) | Vector of color names |
|
Three-column matrix of RGB triplets | [1 0 0 0 1 1 1 0 1 1 1 1]  |

This table lists the supported shape colors.
| Color Name | Short Name | RGB Triplet | Appearance |
|---|---|---|---|
"red" | "r" | [1 0 0] |
|
"green" | "g" | [0 1 0] |
|
"blue" | "b" | [0 0 1] |
|
"cyan" | "c" | [0 1 1] |
|
"magenta" | "m" | [1 0 1] |
|
"yellow" | "y" | [1 1 0] |
|
"black" | "k" | [0 0 0] |
|
"white" | "w" | [1 1 1] |
|
Data Types: logical | uint8 | uint16 | int16 | double | single | cell
Opacity of a filled shape, specified as a scalar in the range [0 1]. The
Opacity argument applies to only the
"filled-rectangle", "filled-polygon", and
"filled-circle" shapes.
Data Types: double | single | int8 | int16 | int32 | int64 | uint8 | uint16 | uint32 | uint64
Smooth shape edges, specified as a logical 1 (true) or
0 (false). A true value
enables an antialiasing filter to smooth shape edges. This value applies to only
nonrectangular shapes. When you enable antialiasing requires additional time to draw
the shapes.
Data Types: logical