Plot Hough Transform of Image
This example shows you how to plot the Hough Transform of an image.
Example Model
Open the Simulink® model.
modelname = "ex_blkHoughTransform.slx";
open_system(modelname)
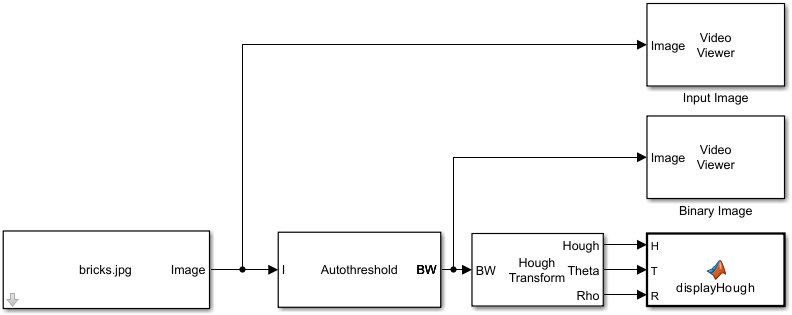
The model reads an input image using an Image From File block with the File name parameter set to bricks.jpg and the Sample time parameter set to 0.1. The Autothreshold block converts the input image to a binary matrix.
To find the Hough Transform of the binary image, the model uses a Hough Transform block. To enable you to plot the Hough Transform, the Output theta and rho values parameter of the Hough Transform block is on, enabling the Theta and Rho output ports of the block.
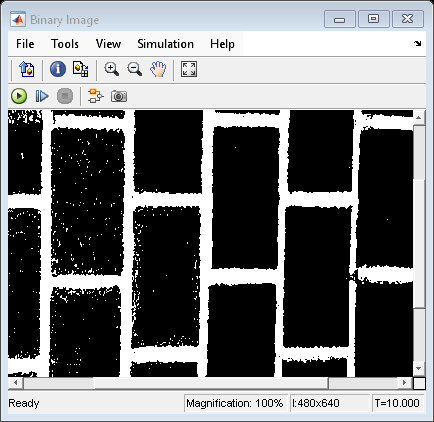
The Video Viewer blocks display the input image and the binary image.
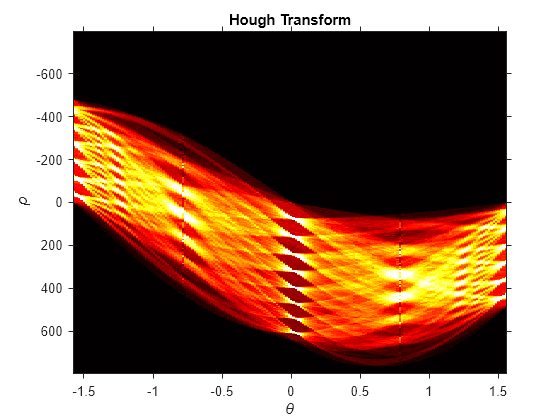
The MATLAB Function (Simulink) block implements the custom function displayHough to plot the Hough Transform.
Simulate the Model
Run the model. The Video Viewer blocks display the input image and its binary form. The plot displays the Hough Transform of the binary image.
output = sim(modelname)


output =
  Simulink.SimulationOutput:

                   tout: [101x1 double]

     SimulationMetadata: [1x1 Simulink.SimulationMetadata]
           ErrorMessage: [0x0 char]