Hi all,
I have a 30,000 x 12 x 4 timetable (called SR) with tree stem diameter values measured every 20 minutes.
Within the data, I identified periods of contracted stems lasting longer than 2 days (>144 consecutive values), let's call them "drought" for simplicity. These values (-2 for "drought", NaN otherwise) are saved as a separate timetable variable called Drought. When plotting the stem diameter data in a simple line plot, I would like to add a pink background to mark all periods of "drought".
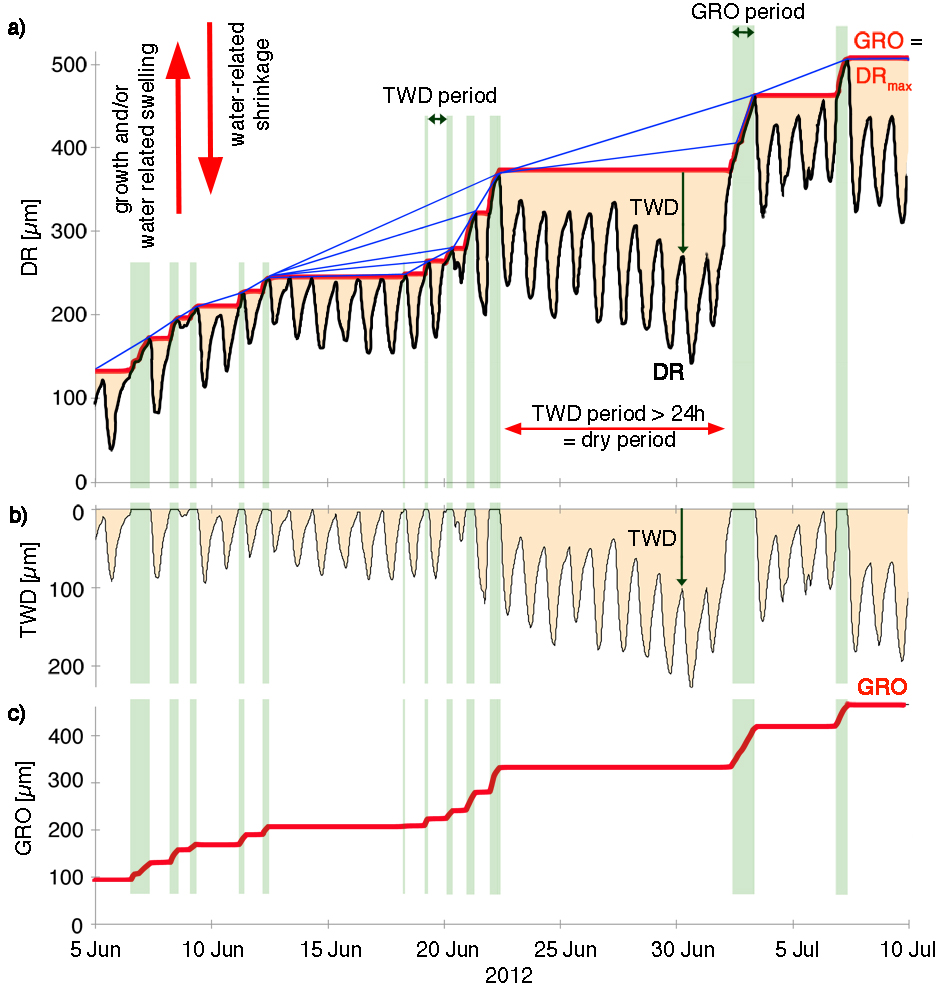
In the example below (source: natkon.ch), periods of growth were marked with green background. I want to do the same, but for dry periods (i.e. value -2 in the variable Drought) in pink. On top of the pink background I'll be plotting the stem radii (black line in the example below).
I've read about the rectangle and patch functions, but, being a beginner Matlab user, I'm not sure how to specify the coordinates. Due to the amount of data, I'll be plotting it in a loop. Do I need to use a loop similar to the one I used to identify the "drought" periods, or is there an easier way?
for k = 1:size(Drought,3)
for j = 1:size(Drought,2)
for i = 2:size(Drought,1)
if Drought(i,j,k) == -1 && isequal(Drought(i-1,j,k),-1)==0
DroughtStart = i;
elseif isequal(Drought(i,j,k),-1)==0 && Drought(i-1,j,k) == -1
if i-DroughtStart > 144
Drought(DroughtStart:i-1,j,k) = -2;
end
end
end
end
end
EDIT: More details about the data as requested:
The dimensions of the timetable (30,000 x 12 x 4) correspond to time (30,000 time steps), treatments (12) and sites (4). At each site, only some treatments are present; the remaining columns contain NaNs.
Attached is a one-month extract from the stem radii and "drought" data.