How to determine the minimum point of a plot?
Este tema ha sido cerrado permanentemente y transferido a MATLAB Answers.
Hi,
I have a plot as attached herewith in which the value of the point as shown by arrow mark is to be determined and compared to a reference value. It is plotted at a time step of 999 (t ranges from 1 to 1000).
global data;
cp=0;
for i=999:max(length(data.variable.t))
for j=60:max(length(data.variable.x))-1
if data.variable.curvepressure(i,j) <= -10.2661
disp(data.variable.curvepressure(i,j))
cp=1;
break
end
end
end
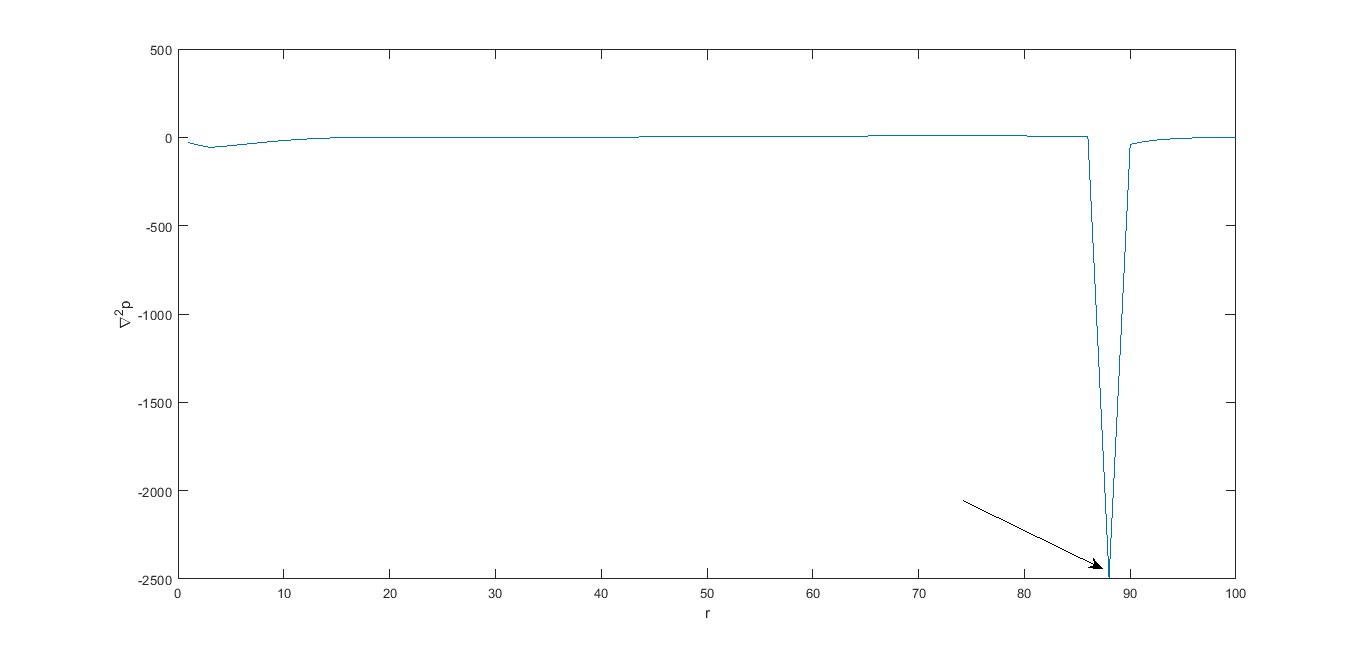
The above code is not working and need your advice please.
1 Comentario
Tiempo descendente
Good! What exactly is your question? Do you want to create this plot?
Se han desactivado los comentarios.
Etiquetas


