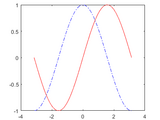
This function plots multiple 2-D lines in a figure. It is an alternative to using: plot(X1,Y1,LineSpec1,...,Xn,Yn,LineSpecn)
plot2(X,Y) creates a 2-D line plot of the data in Y versus the corresponding values in X.
plot2(X,Y,LineSpec) creates the plot using the specified line style, marker, and color.
X,Y, and LineSpec are cell arrays with the same length, such that X{i} , Y{i} , and LineSpec{i} are X data, Y data, and line specifications of the ith line to be plotted.
Example:
X{1}=-pi:pi/100:pi;
Y{1}=cos(X{1});
LineSpec{1}='b--';
X{2}=-pi:pi/100:pi;
Y{2}=sin(X{2});
LineSpec{2}='r-';
figure;
plot2(X,Y);
figure;
plot2(X,Y,LineSpec);
Citar como
Ayad Al-Rumaithi (2025). Plot Cell Array Data (https://la.mathworks.com/matlabcentral/fileexchange/131723-plot-cell-array-data), MATLAB Central File Exchange. Recuperado .
Compatibilidad con la versión de MATLAB
Se creó con
R2023a
Compatible con cualquier versión
Compatibilidad con las plataformas
Windows macOS LinuxEtiquetas
Community Treasure Hunt
Find the treasures in MATLAB Central and discover how the community can help you!
Start Hunting!Descubra Live Editor
Cree scripts con código, salida y texto formateado en un documento ejecutable.

