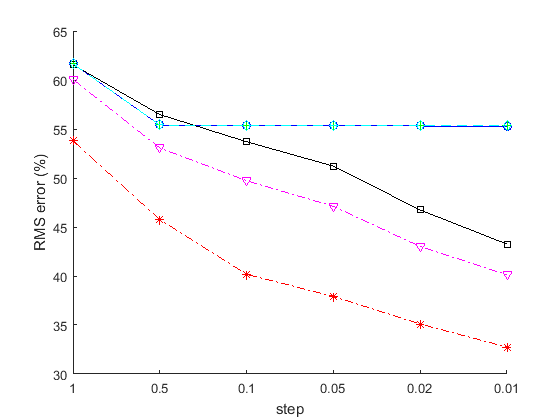
Plot with linestyles and markers
MATLAB plot function plots the different lines with different colours, but the same linestyle and no marker, which gives a poor visibility when printing in black and white (typical publication).
This function modifies the linestyles and markers as well.
Can handle different drawing functions such as plot, semilogx, semilogy, ...
Citar como
Sébastien Martin (2025). Plot with linestyles and markers (https://la.mathworks.com/matlabcentral/fileexchange/52091-plot-with-linestyles-and-markers), MATLAB Central File Exchange. Recuperado .
Compatibilidad con la versión de MATLAB
Compatibilidad con las plataformas
Windows macOS LinuxCategorías
- MATLAB > Graphics > 2-D and 3-D Plots > Line Plots >
Etiquetas
Community Treasure Hunt
Find the treasures in MATLAB Central and discover how the community can help you!
Start Hunting!Descubra Live Editor
Cree scripts con código, salida y texto formateado en un documento ejecutable.
| Versión | Publicado | Notas de la versión | |
|---|---|---|---|
| 1.0.0.0 | Added a thumbnail picture |
También puede seleccionar uno de estos países/idiomas:
América
- América Latina (Español)
- Canada (English)
- United States (English)
Europa
- Belgium (English)
- Denmark (English)
- Deutschland (Deutsch)
- España (Español)
- Finland (English)
- France (Français)
- Ireland (English)
- Italia (Italiano)
- Luxembourg (English)
- Netherlands (English)
- Norway (English)
- Österreich (Deutsch)
- Portugal (English)
- Sweden (English)
- Switzerland
- United Kingdom(English)
Asia-Pacífico
- Australia (English)
- India (English)
- New Zealand (English)
- 中国
- 日本Japanese (日本語)
- 한국Korean (한국어)