Main Content

seqlogo

Display sequence logo for nucleotide or amino acid sequences

    Description

    seqlogo(Seqs) displays a sequence logo for Seqs, a set of aligned sequences. The logo graphically displays the sequence conservation at a particular position in the alignment of sequences, measured in bits. The maximum sequence conservation per site is log2(4) bits for nucleotide sequences and log2(20) bits for amino acid sequences. If the sequence conservation value is zero or negative, no logo is displayed in that position.

    example

    seqlogo(Profile) displays a sequence logo for Profile, a sequence profile distribution matrix with the frequency of nucleotides or amino acids for every column in the multiple alignment, such as returned by the seqprofile function.

    WgtMatrix = seqlogo(___) returns a cell array of unique symbols in the sequence Seqs or Profile, and the information weight matrix used to graphically display the logo.

    [WgtMatrix, Handle] = seqlogo(___) returns a handle to the sequence logo figure.

    seqlogo(Seqs,Name,Value) uses additional options specified by one or more Name,Value pair arguments.

    example

    Examples

    collapse all

    This example shows how to display a sequence logo for a set of aligned nucleotide sequences.

    Create a series of aligned nucleotide sequences.

    S = {'ATTATAGCAAACTA',...
         'AACATGCCAAAGTA',...
         'ATCATGCAAAAGGA'}
    
    S =
    
      1x3 cell array
    
        {'ATTATAGCAAACTA'}    {'AACATGCCAAAGTA'}    {'ATCATGCAAAAGGA'}


    Display the sequence logo.

    seqlogo(S)
    

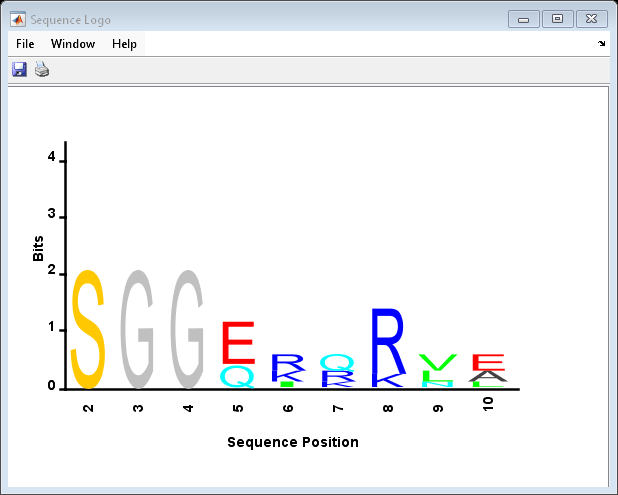
    This example shows how to display a sequence logo for a set of aligned amino acid sequences.

    Create a series of aligned amino acid sequences.

    S2 = {'LSGGQRQRVAIARALAL',...
          'LSGGEKQRVAIARALMN',...
          'LSGGQIQRVLLARALAA',...
          'LSGGERRRLEIACVLAL',...
          'FSGGEKKKNELWQMLAL',...
          'LSGGERRRLEIACVLAL'};
    

    Display the sequence logo, specifying an amino acid sequence and limiting the logo to sequence positions 2 through 10.

    seqlogo(S2, 'alphabet', 'aa', 'startAt', 2, 'endAt', 10)
    

    Input Arguments

    collapse all

    Set of pairwise or multiply aligned nucleotide or amino acid sequences, represented by any of the following:

    • Character array

    • Cell array of character vectors

    • String vector

    • Array of structures containing a Sequence field

    Sequence profile distribution matrix with the frequency of nucleotides or amino acids for every column in the multiple alignment, such as returned by the seqprofile function.

    The size of the frequency distribution matrix is:

    • For nucleotides — [4 x sequence length]

    • For amino acids — [20 x sequence length]

    If gaps were included, Profile may have 5 rows (for nucleotides) or 21 rows (for amino acids), but seqlogo ignores gaps.

    Color Code for Nucleotides

    Nucleotide Color
    AGreen
    CBlue
    GYellow
    T, URed
    OtherPurple

    Color Code for Amino Acids

    Amino Acid Chemical PropertyColor
    G S T Y C Q NPolarGreen
    A V L I P W F MHydrophobicOrange
    D EAcidicRed
    K R HBasicBlue
    OtherTan

    Name-Value Arguments

    Specify optional pairs of arguments as Name1=Value1,...,NameN=ValueN, where Name is the argument name and Value is the corresponding value. Name-value arguments must appear after other arguments, but the order of the pairs does not matter.

    Example: 'Replicates',5 specifies to repeat the algorithm five times.

    Control the display of a sequence logo.

    Example: 'Displaylogo',false

    Character vector or string specifying the type of sequence (nucleotide or amino acid).

    Note

    If you provide amino acid sequences to seqlogo, you must set Alphabet to 'AA'.

    Example: 'Alphabet','AA'

    Specify the starting position for the sequences in Seqs.

    Example: 'Startat',2

    Specify the ending position for the sequences in Seqs. The default value is the maximum length of the sequences in Seqs.

    Example: 'Endat',20

    Control the use of small sample correction in the estimation of the number of bits.

    Note

    A simple calculation of bits tends to overestimate the conservation at a particular location. To compensate for this overestimation, when SSCorrection is set to true, a rough estimate is applied as an approximate correction. This correction works better when the number of sequences is greater than 50.

    Example: 'SSCorrection',false

    Output Arguments

    collapse all

    Cell array containing the symbol list in Seqs or Profile and the weight matrix used to graphically display the sequence logo.

    Handle to the sequence logo figure.

    References

    [1] Schneider, T.D., and Stephens, R.M. (1990). Sequence Logos: A new way to display consensus sequences. Nucleic Acids Research 18, 6097–6100.

    Version History

    Introduced before R2006a