Centro de ayudaCentro de ayuda
Representar una regresión lineal
plotregression(targets,outputs)
plotregression(targs1,outs1,'name1',targs2,outs2,'name2',...)
ejemplo
plotregression(targets,outputs) representa la regresión lineal de targets relativa a outputs.
targets
outputs
plotregression(targs1,outs1,'name1',targs2,outs2,'name2',...)genera varias gráficas.
contraer todo
Este ejemplo muestra cómo representar la regresión lineal de una red prealimentada.
[x,t] = simplefit_dataset; net = feedforwardnet(10); net = train(net,x,t);
y = net(x); plotregression(t,y,'Regression')
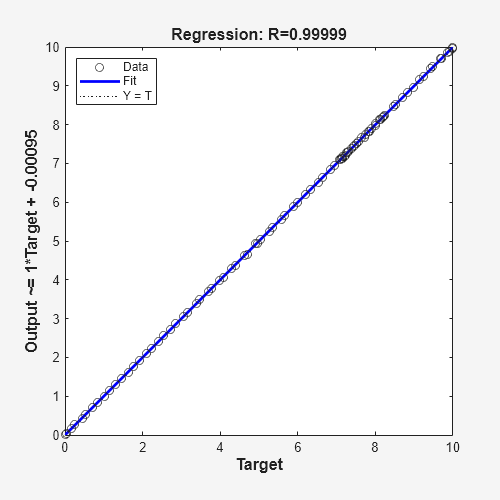
Objetivos de la red, especificados como una matriz o un arreglo de celdas.
Salidas de la red, especificadas como una matriz o un arreglo de celdas.
Introducido en R2008a
plottrainstate
Ha hecho clic en un enlace que corresponde a este comando de MATLAB:
Ejecute el comando introduciéndolo en la ventana de comandos de MATLAB. Los navegadores web no admiten comandos de MATLAB.
Select a Web Site
Choose a web site to get translated content where available and see local events and offers. Based on your location, we recommend that you select: .
You can also select a web site from the following list:
Select the China site (in Chinese or English) for best site performance. Other MathWorks country sites are not optimized for visits from your location.
Contact your local office