GeographicGlobe
Control geographic globe appearance and behavior
Description
Use a geographic globe to plot 3-D lines and markers over basemaps and terrain.
Creation
Create a geographic globe object using the geoglobe
function.
Properties
Maps
Map on which to plot data, specified as one of the values listed in the table. Six of the basemaps in the table are tiled data sets created using Natural Earth. Five of the basemaps are high-zoom-level maps hosted by Esri®.
|
|
Full global basemap composed of high-resolution satellite imagery. Hosted by Esri. |
|
General-purpose road map that emphasizes accurate, legible styling of roads and transit networks. Hosted by Esri. |
|
|
Map designed to provide geographic context while highlighting user data on a light background. Hosted by Esri. |
|
Map designed to provide geographic context while highlighting user data on a dark background. Hosted by Esri. |
|
|
General-purpose map with styling to depict topographic features. Hosted by Esri. |
|
Map that combines satellite-derived land cover data, shaded relief, and ocean-bottom relief. The light, natural palette is suitable for thematic and reference maps. Created using Natural Earth. |
|
|
Shaded relief map blended with a land cover palette. Humid lowlands are green and arid lowlands are brown. Created using Natural Earth. |
|
Terrain map in shades of gray. Shaded relief emphasizes both high mountains and micro-terrain found in lowlands. Created using Natural Earth. |
|
|
Two-tone, land-ocean map with light green land areas and light blue water areas. Created using Natural Earth. |
|
Two-tone, land-ocean map with gray land areas and white water areas. Created using Natural Earth. |
|
|
Two-tone, land-ocean map with light gray land areas and dark gray water areas. This basemap is installed with MATLAB®. Created using Natural Earth. | Not applicable. | Custom basemap added using the |


All basemaps except 'darkwater' require Internet access. The
'darkwater' basemap is included with MATLAB and Mapping Toolbox™.
If you do not have consistent access to the Internet, you can download the basemaps created using Natural Earth onto your local system by using the Add-On Explorer. The basemaps hosted by Esri are not available for download. For more about downloading basemaps and changing the default basemap on your local system, see Access Basemaps and Terrain for Geographic Globe.
The basemaps hosted by Esri update periodically. As a result, you might see differences in your visualizations over time.
Alignment of boundaries and region labels are a presentation of the feature provided by the data vendors and do not imply endorsement by MathWorks®.
Example: g = geoglobe(uifigure,'Basemap','bluegreen')
Example: g.Basemap = 'bluegreen'
Data Types: char | string
Terrain data, specified as one of these values:
'gmted2010'— Tiled global terrain derived from the GMTED2010 model by the U.S. Geological Survey (USGS) and National Geospatial-Intelligence Agency (NGA) and hosted by MathWorks. Internet access is required to use'gmted2010'.'none'— No terrain.String scalar or character vector — Name of custom terrain added using the
addCustomTerrainfunction.
Data Types: char | string
Since R2026a
Buildings data, specified as one of these values:
'none'— No buildings.String scalar or character vector — Name of custom buildings added using the
addCustomBuildingsfunction. The buildings must be within the extent of the terrain specified by theTerrainproperty.
Data Types: char | string
Multiple Plots
Color order for lines plotted on the globe, specified as a three-column matrix of RGB triplets. This property defines the palette of colors MATLAB uses to create plot objects such as lines. Each row of the array is an RGB triplet. An RGB triplet is a three-element vector whose elements specify the intensities of the red, green, and blue components of a color. The intensities must be in the range [0, 1]. This table lists the default colors.
This table lists the default color palettes for plots in the light and dark themes.
| Palette | Palette Colors |
|---|---|
Before R2025a: Most plots use these colors by default. |
|
|
|
You can get the RGB triplets and hexadecimal color codes for these palettes using the orderedcolors and rgb2hex functions. For example, get the RGB triplets for the "gem" palette and convert them to hexadecimal color codes.
RGB = orderedcolors("gem");
H = rgb2hex(RGB);
Before R2023b: Get the RGB triplets using RGB =
get(groot,"FactoryAxesColorOrder").
Before R2024a: Get the hexadecimal color codes using H =
compose("#%02X%02X%02X",round(RGB*255)).
MATLAB assigns colors to objects according to their order of creation. For example, when plotting lines, the first line uses the first color, the second line uses the second color, and so on. If there are more lines than colors, then the cycle repeats.
Changing the Color Order Before or After Plotting
You can change the color order in either of these ways:
Call the
colororderfunction to change the color order for all the globe objects in a UI figure. The colors of existing plots in the figure update immediately. If you place additional globe objects into the figure, those globe objects also use the new color order. If you continue to call plotting commands, those commands also use the new colors.Set the
ColorOrderproperty on the globe, call theholdfunction to set the globe hold state to"on", and then call the desired plotting functions. Unlike thecolororderfunction, this process sets the color order for the specific axes rather than the entire figure. You must set theholdstate to"on"to ensure that subsequent plotting commands do not reset the axes to use the default color order.
This property is read-only.
SeriesIndex value for the next plot object added to the
globe, returned as a whole number greater than or equal to 0. This
property is useful when you want to track how the objects cycle through the colors in
the color order. This property maintains a count of the objects in the globe that have
a SeriesIndex property. MATLAB uses it to assign the value of the SeriesIndex
property for each new object. The count starts at 1 when you create
the globe, and it increases by 1 for each additional object. Thus,
the count is typically n+1, where n is the
number of objects in the globe.
Properties to reset when adding a new plot to the globe, specified as one of these values:
'add'— Add new plots to the existing globe. Do not delete existing plots or reset globe properties before displaying the new plot.'replacechildren'— Delete existing plots before displaying the new plot. Reset theColorOrderIndexproperty to1, but do not reset other globe properties. The next plot added to the globe uses the first color based on theColorOrderproperty.'replace'— Delete existing plots and reset globe properties, exceptPosition,Units,Basemap,Terrain, andBuildings, to their default values before displaying the new plot.'replaceall'— Delete existing plots and reset globe properties, exceptPositionandUnits, to their default values before displaying the new plot.
Position
Size and location, specified as a four-element vector of the form [left
bottom width height]. By default, MATLAB measures the values in units normalized to the container. To change the
units, set the Units property.
The
leftandbottomelements define the distance from the lower left corner of the container UI figure, panel, or tab to the lower left corner of the position boundary.The
widthandheightelements are the position boundary dimensions.
Position units, specified as one of these values.
Units | Description |
|---|---|
'normalized' (default) | Units normalized with respect to the container, which is typically the figure or a panel. The
lower left corner of the container is (0,0) and
the upper right corner is (1,1). |
'inches' | Inches. |
'centimeters' | Centimeters. |
'characters' | Units based on the default
|
'points' | Typography points. One point equals 1/72 inch. |
'pixels' | Pixels. On Windows® and Macintosh systems, the size of a pixel is 1/96th of an inch. This size is independent of your system resolution. On Linux® systems, the size of a pixel is determined by your system resolution. |
When specifying the units as a name-value pair during object creation, specify the
Units name-value pair before specifying name-value pairs that
use those units, for example Position.
Interactivity
Parent/Child
Parent container, specified as a Figure object created using the
uifigure function, a Panel object within a UI
figure, or a Tab object within a UI figure.
Children, returned as an array of graphics objects. Use this property to view a list of the children or to reorder the children by setting the property to a permutation of itself.
You cannot add or remove children using the Children property.
To add a child to this list, set the Parent property of the child
graphics object to the GeographicGlobe
object.
Identifiers
This property is read-only.
Type of graphics object returned as 'globe'.
Object Functions
Change Hold State and Basemap
hold | These
|
geobasemap | This
|
Change View
campos | Set or query position of camera for geographic globe |
camheight | Set or query height of camera for geographic globe |
camheading | Set or query heading angle of camera for geographic globe |
campitch | Set or query pitch angle of camera for geographic globe |
camroll | Set or query roll angle of camera for geographic globe |
Examples
Display a geographic globe in a figure created using the uifigure function.
uif = uifigure;
g = geoglobe(uif);

Version History
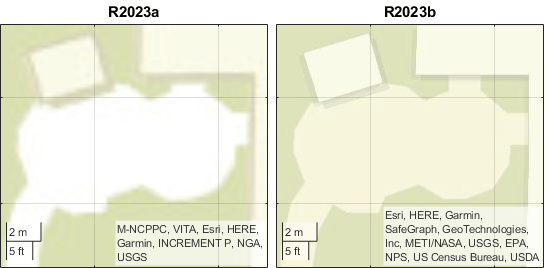
Introduced in R2020aThe "streets-light", "streets-dark", "streets", and "topographic" basemaps hosted by Esri have an improved visual appearance at high zoom levels. For example, this image compares a basemap at zoom level 21 in R2023a with the same basemap and zoom level in R2023b.
The basemaps can also have different appearances at other zoom levels. For example, this image compares a basemap at zoom level 15 in R2023a with the same basemap and zoom level in R2023b.

When the value of the NextPlot property is
'replace', adding new plots does not reset the
Basemap or Terrain properties. As a result, when
you add a plot to a geographic globe by using the geoplot3 function,
MATLAB does not reset the basemap or terrain. In R2022a and earlier releases, the
basemap and terrain reset when you add new plots.
As a result, you can specify the basemap or terrain and then visualize data without
using the hold function. For example, this code creates a globe using
the "streets" basemap and no terrain data. Then, it displays a plot and
adjusts the camera view. In R2022b, the basemap and terrain do not reset. In R2022a and
earlier releases, the basemap reset to the default "satellite" and the
terrain reset to the default "gmted2010".
lat = [42.3501 42.3515 42.3598 42.3584 42.3529 42.3626];
lon = [-71.0870 -71.0926 -71.0662 -71.0598 -71.0662 -71.0789];

uif = uifigure;
g = geoglobe(uif,Basemap="streets",Terrain="none");

p = geoplot3(g,lat,lon,0,"ro",LineWidth=3);
campos(g,42.33,-71.0756,2113)
campitch(g,-42.2458)

This change does not affect existing code that sets the hold state to
"on" between commands.
To reset the basemap and terrain, set the Basemap and
Terrain properties to the defaults after you create the plot.
g.Basemap = "satellite";
g.Terrain = "gmted2010";
For more information about changing the basemap and terrain of geographic globes, see Access Basemaps and Terrain for Geographic Globe.