Reference Regularly Spaced Raster Data Using Coordinates
Many Mapping Toolbox™ functions that analyze or display raster data require you to specify the data using an array of data values and a raster reference object. A raster reference object enables MATLAB® to associate each element of the array with a location in geographic or planar coordinates.
For many geospatial file formats, you can use Mapping Toolbox functions to import the referencing information into the workspace as a raster reference object. For a list of supported geospatial file formats, see Supported Geospatial File Formats for Import and Export.
For other file formats, including netCDF, the import functions read the referencing information into the workspace as coordinate arrays instead of a raster reference object. In these cases, you must manually create the raster reference object and format your data values so that they are compatible with the reference object. For a list of the file formats and import functions that MATLAB supports, see Supported File Formats for Import and Export.
Coordinate arrays can have different shapes and sizes. As a result, there are multiple strategies you can use to create raster reference objects. This example shows one strategy using regularly spaced data of snow cover from a netCDF file. Each step includes details to consider when applying the strategy to your own data. The example involves these steps:
Read the data into the workspace.
Verify that the coordinates are regularly spaced.
Create the raster reference object.
Format the array of data values to be compatible with the reference object.
Determine the array edges from which column and row indexing start.
Display the raster data on a map.
Read Data
Read raster data into the workspace as an array of latitude coordinates or x-coordinates, an array of longitude coordinates or y-coordinates, and an array of data values.
Read a netCDF file from a website and save it to the file snowcover.nc. The file contains latitude, longitude, and snow cover data for the northern hemisphere [1], measured monthly from 1971 to 1995. The snow cover data represents the monthly mean of snow cover, measured in percentage of ground covered by snow. For more information about the data, see [2].
url = "https://downloads.psl.noaa.gov/Datasets/snowcover/snowcover.mon.mean.nc";
filename = "snowcover.nc";
websave(filename,url);
Read the latitude and longitude data into the workspace as lat and lon, respectively. The lat variable is a 90-element vector. The lon variable is a 360-element vector.
lat = ncread(filename,"lat");
lon = ncread(filename,"lon");
Read the snow cover data into the workspace as an array. The scAll variable is a 360-by-90-by-297 array, where each page of the array represents snow cover data for a different month. Extract the first page from the array.
scAll = ncread(filename,"snowcover");
sc = scAll(:,:,1);
For more information about reading data from netCDF files, see Import NetCDF Files and OPeNDAP Data.
Verify Coordinates are Regularly Spaced
Reference objects require the coordinates to be regularly spaced. One way to check whether coordinates are regularly spaced is to calculate the differences between adjacent coordinates. If all the differences match, then the coordinates are regularly spaced. If the coordinates are not regularly spaced, see Reference Scattered Raster Data Using Interpolation.
Calculate the differences between adjacent latitude and longitude coordinates by using the diff function.
dLat = diff(lat);
dLon = diff(lon);
Find the unique differences in latitude by using the unique function. All the differences are -1, which indicates that the latitudes are regularly spaced and that adjacent latitudes are separated by 1 degree.
dLatUnique = unique(dLat)
dLatUnique = single

-1
Find the unique differences in longitude. All the differences are 1, which indicates that the longitudes are regularly spaced and that adjacent longitudes are separated by 1 degree.
dLonUnique = unique(dLon)
dLonUnique = single

1
When the coordinates are vectors with repeating sequences, the unique function can report two unique differences. For example, if the unique differences in latitude are 1 and 180, the value 1 indicates that adjacent latitudes are separated by 1 degree and the value 180 represents adjacent latitudes that wrap around from –90 degrees to 90 degrees. In this case, the coordinates are regularly spaced.
You can also check whether coordinates are regularly spaced using one of these methods:
Visually inspect the coordinates by using the Command Window or the Variables editor.
Use the
isuniformfunction. This function is useful for coordinate vectors without repeating sequences.
Create Raster Reference Object
Create a reference object for the raster data.
Information from [2] indicates that the snow cover data is a grid of samples referenced to geographic coordinates. Therefore, you can create the reference object by using the georefpostings function.
Calculate the latitude and longitude limits of the raster. Then, create the reference object. Specify the latitude limits, the longitude limits, the difference between adjacent latitudes, and the difference between adjacent longitudes as inputs to the function. Specify a positive difference between adjacent latitudes by using the abs function.
[latmin,latmax] = bounds(lat,"all");
latlim = [latmin latmax];

[lonmin,lonmax] = bounds(lon,"all");
lonlim = [lonmin lonmax];

R = georefpostings(latlim,lonlim,abs(dLatUnique),dLonUnique);
If your data is a grid of samples referenced to projected coordinates, then use the maprefpostings function instead. If your data represents a grid of cells or pixels, then use the georefcells or maprefcells function instead. If you do not know whether your data represents a grid of samples or a grid of cells, see Reference Raster Data Using Geographic or World Limits.
Format Array of Data Values
Format the array of data values so that the array is compatible with the reference object. An array is compatible with a reference object when the array satisfies these conditions:
Each row of the array corresponds to the same latitude or y-coordinate.
Each column of the array corresponds to the same longitude or x-coordinate.
The height and width of the array matches the value stored in the
RasterSizeproperty of the reference object.
The coordinates associated with the snow cover data are vectors that do not contain repeating sequences. As a result, you can check whether the snow cover data is compatible with the reference object by comparing the sizes of the coordinate vectors with the size of the snow cover matrix.
If the length of the latitude vector and the width of the snow cover matrix are equal, then each row of the matrix corresponds to the same latitude.
If the length of the longitude vector and the height of the snow cover matrix are equal, then each column of the matrix corresponds to the same longitude.
Display the length of the latitude vector, the length of the longitude vector, the height of the snow cover matrix, and the width of the snow cover matrix.
disp(...
"Length of latitude vector: " + length(lat) + newline + ...
"Length of longitude vector: " + length(lon) + newline + ...
"Height of snow cover matrix: " + height(sc) + newline + ...
"Width of snow cover matrix: " + width(sc))
Length of latitude vector: 90
Length of longitude vector: 360
Height of snow cover matrix: 360
Width of snow cover matrix: 90
The result shows that the height and width of the matrix are reversed. Reformat the matrix by calculating its transpose.
scT = sc';
Check that the size of the transposed matrix matches the value stored in the RasterSize property of the reference object.
sz = size(scT);
isequal(sz,R.RasterSize)
ans = logical
   1
The sizes are equal, so the transposed matrix is compatible with the reference object.
Another way to check whether an array is compatible with a reference object is to visually inspect the coordinates. For example:
When the coordinates are vectors with repeating sequences, the array is compatible with the reference object when the latitudes increment over constant longitudes.
When the coordinates are matrices, the array is compatible with the reference object when each row of the latitude matrix corresponds to a single latitude value and each column of the longitude matrix corresponds to a single longitude value.
You can also reformat an array of data values using one of these processes:
Resize the array by using the
reshapefunction. This function is useful for reformatting vectors of data values.When the array is multidimensional, calculate the transpose of the array by using the
pagetransposefunction. This function is useful for calculating the transpose of RGB images.
Determine Direction of Rows and Columns
Determine the edges from which column and row indexing start. By default, reference objects expect the columns of the array to start from south and the rows of the array to start from west. You can change the edges from which column and row indexing start by using the ColumnsStartFrom and RowsStartFrom properties of the reference object, respectively.
Determine the edge from which row indexing starts by comparing the southern longitude limit with the first element of the latitude vector.
isequal(latlim(1),lat(1))
ans = logical
   0
The values are not equal, so column indexing starts from north. Change the ColumnsStartFrom property of the reference object.
R.ColumnsStartFrom = "north";Determine the edge from which row indexing starts by comparing the western longitude limit with the first element of the longitude vector.
isequal(lonlim(1),lon(1))
ans = logical
   1
The values are equal, so row indexing starts from west. This result matches the default for the reference object, so you do not need to update the RowsStartFrom property.
Another way to determine the edges from which column and row indexing start is to view the unique differences in latitude dLatUnique and the unique differences in longitude dLonUnique.
If
dLatUniqueis positive, then column indexing starts from south. Otherwise, column indexing starts from north.If
dLonUniqueis positive, then row indexing starts from west. Otherwise, row indexing starts from east.
Create Map
One way to check that you have correctly referenced your raster data is to display the data on a map.
Create a map that uses the default Equal Earth projection. Specify the transposed matrix and the reference object as input to the geopcolor function.
figure
newmap
geopcolor(scT,R)
Provide geographic context for the map by reading and displaying world land areas. Then, add a title, change the colormap, and add a color bar.
land = readgeotable("landareas.shp");
hold on
geoplot(land,FaceColor="none")

title("Snow Cover (%)")
colormap sky
colorbar
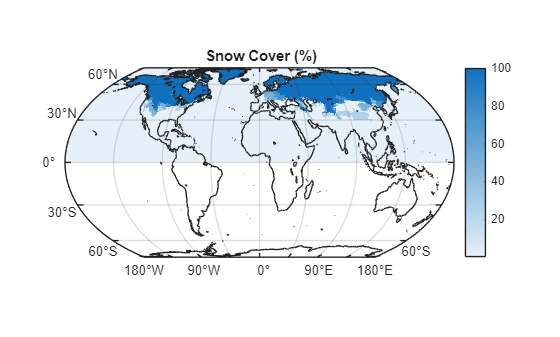
As expected from [2], the map displays the snow cover data in the northern hemisphere. In addition, nonzero snow cover appears within the boundaries of the land areas. These results suggest that the snow cover data is correctly referenced.
If your data represents an RGB or grayscale image, display the data using the geoimage function instead of the geopcolor function.
References
[1] NH Ease-Grid Snow Cover data provided by the NOAA PSL, Boulder, Colorado, USA, from their website at https://psl.noaa.gov.
[2] "NH Ease-Grid Snow Cover." NOAA Physical Sciences Laboratory. Accessed October 14, 2025. https://psl.noaa.gov/data/gridded/data.snowcover.html.
See Also
Functions
unique|diff|georefpostings|transpose