Reference Scattered Raster Data Using Interpolation
Many Mapping Toolbox™ functions that analyze or display raster data require you to specify the data using an array of data values and a raster reference object. A raster reference object enables MATLAB® to associate each element of the array with a location in geographic or planar coordinates.
When your raster data is regularly spaced, you can use Mapping Toolbox functions to import or reference the data. In some cases, the functions import the reference information into the workspace as a reference object. In other cases, you must manually create the reference object. For more information about creating a reference object for regularly spaced data, see Reference Regularly Spaced Raster Data Using Coordinates.
When your raster data is scattered, you must manually create the reference object. In addition, because reference objects require regularly spaced raster data, you must also interpolate the data using a scatteredInterpolant object and a grid of query points from the reference object.
This example shows how to create a referenced bathymetry grid from scattered depth measurements. The example involves these steps:
Read the data into the workspace.
Project the latitude and longitude coordinates to xy-coordinates.
Create the raster reference object.
Get a grid of query points from the reference object.
Interpolate the scattered data using the query points.
Display the raster data on a map.
Read Data
Read raster data into the workspace as arrays of coordinates and an array of data values.
Read a MAT file of scattered depth measurements into the workspace as a structure array. The file contains latitude, longitude, and depth measurements for a region in the Pacific Ocean.
S = load("seamount.mat");Extract the latitudes, longitudes, and depth measurements from the structure array. Each variable is a 294-element vector.
lat = S.y;
lon = S.x;
depth = S.z;
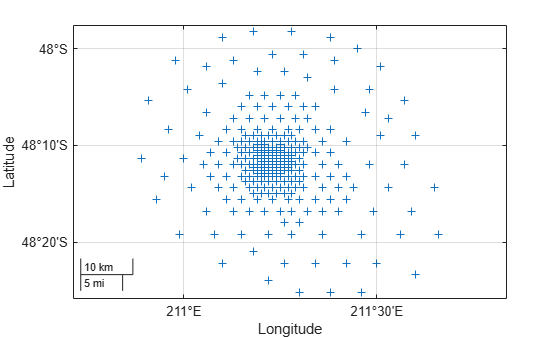
Preview the data by displaying the latitude and longitude coordinates on a map.
figure
geobasemap none
geoscatter(lat,lon,"+")
Project Coordinates
Prepare to interpolate the data by projecting the latitude and longitude coordinates to xy-coordinates. When you interpolate data using a scatteredInterpolant object, working in xy-coordinates ensures that the query points are evenly spaced in linear units, which improves the accuracy of the interpolation. If you decide to work in latitude and longitude coordinates, then the query points will be evenly spaced in angular units but unevenly spaced in linear units. As a result, working with latitude and longitude coordinates can distort the results of the interpolation, especially for large or polar regions.
Create a projected coordinate reference system (CRS) object that is appropriate for the region by using the projcrs function. For this example, use the WGS84 / UTM Zone 6S projected CRS, which has the EPSG authority code 32706. If your data is already in xy-coordinates, then prepare to display the interpolated data by creating a projected CRS object for the coordinates.
proj = projcrs(32706);
Project the latitude and longitude coordinates to xy-coordinates by using the projfwd function. If your data is already in xy-coordinates, then skip this step.
[x,y] = projfwd(proj,lat,lon);
Create Raster Reference Object
Create a raster reference object for the projected coordinates by using the maprefcells function, the xy-limits of the raster, and a raster size that you specify. The maprefcells function creates a reference object for a regularly spaced raster of cells in projected coordinates, where each cell represents an area.
Calculate the xy-limits of the raster.
[xmin,xmax] = bounds(x,"all");
xlimits = [xmin xmax];

[ymin,ymax] = bounds(y,"all");
ylimits = [ymin ymax];
The raster size you specify determines the resolution of the interpolated data. For this example, specify the width and height of the raster so that the width and height of each grid cell is about 100 meters.
w = ceil((xmax-xmin)/100);
h = ceil((ymax-ymin)/100);

sz = [h w];
Create the reference object by using the maprefcells function. Specify the xy-limits and the raster size as inputs to the function. Then, specify the projected CRS of the reference object.
R = maprefcells(xlimits,ylimits,sz);
R.ProjectedCRS = proj;
View the width and height of each grid cell by querying the CellExtentInWorldX and CellExtentInWorldY properties of the reference object. Note that they are each about 100 meters.
R.CellExtentInWorldX
ans =
99.9593
R.CellExtentInWorldY
ans =
99.9636
Get Query Points
Prepare to interpolate the scattered data by getting a grid of query points from the raster reference object.
The reference object defines the xy-coordinates of a regularly spaced raster of cells. Extract the xy-coordinates from the reference object by using the worldGrid function.
[Xq,Yq] = worldGrid(R);
Interpolate Scattered Data
Interpolate the scattered data by using an interpolant. An interpolant is an interpolating function, created from sample values, that you can evaluate at query points.
Create a scattered interpolant object by using the scatteredInterpolant function. For raster data with multiple bands, such as RGB images, create a scattered interpolant object for each band.
Specify the sample values using the scattered x-coordinates, y-coordinates, and depth measurements.
Use natural-neighbor interpolation by setting the
Methodproperty of the object to"natural". This method is appropriate for depth measurements because both the interpolant and its first derivative are continuous.Avoid extrapolating values outside the convex hull of the scattered data by setting the
ExtrapolationMethodproperty of the object to"none". The convex hull is the smallest convex polygon that encloses the data.
F = scatteredInterpolant(x,y,depth);
F.Method = "natural";
F.ExtrapolationMethod = "none";
Evaluate the interpolant at the query points. For raster data with multiple bands, evaluate the interpolant for each band at the query points.
Dq = F(Xq,Yq);
The array Dq and the reference object R represent a referenced bathymetry grid, where values outside the convex hull of the scattered data are NaN. Check that the size of the grid matches the raster size reported by the reference object.
szDq = size(Dq);
isequal(szDq,R.RasterSize)
ans = logical
   1
Create Map
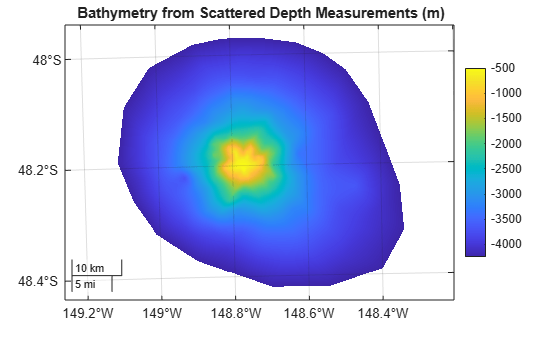
Display the bathymetry grid on a map.
Create a map that uses the WGS84 / UTM Zone 6S projected CRS. Display the data on the map by specifying the array Dq and the reference object R as input to the geopcolor function. The NaN values in the array appear transparent on the map.
figure
newmap(proj)
geopcolor(Dq,R)
Add a title and a color bar. Change the tick format to decimal degrees.
title("Bathymetry from Scattered Depth Measurements (m)")
colorbar
geotickformat dd
Alternate Functionality
If you want to work in latitude and longitude coordinates, you can use the geoloc2grid function to interpolate the scattered data and create a raster reference object. However, the function can distort the results of the interpolation, especially for large or polar regions. In addition, the function supports only linear interpolation.