Compare Global, Moving, and Cumulative Statistics
You can summarize and analyze data by computing different types of statistics. Each type of statistic gives different insights into your data.
Global statistics compute a single value over the entire data set.
Moving statistics compute values over a sliding window of neighboring data points.
Cumulative statistics compute values up to each data point.
Local statistics compute a single value over a subset of the data.
Global Statistics
A global statistic summarizes a data set using a single value, such as the mean or minimum. Use a global statistic when you want to broadly summarize your data or compare different data sets without showing local variation.
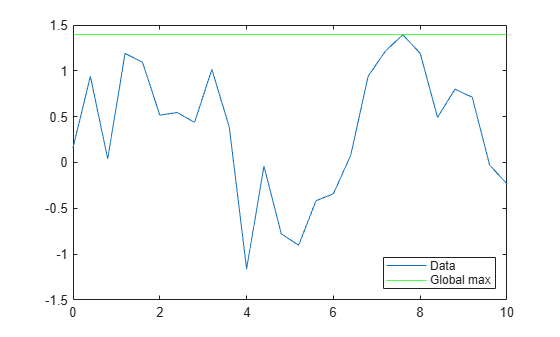
For example, compute and visualize the global maximum of a sample vector y. The global maximum helps identify the highest value in the vector, but does not give any insight into the variation within the vector.
rng("default")
t = [0:0.4:10];
y = sin(t) + 0.3*randn(size(t));
yGlobalMax = max(y)
yGlobalMax = 1.3931
plot(t,y,DisplayName="Data")
hold on
yline(yGlobalMax,"g",DisplayName="Global max")
legend(Location="southeast")
Moving Statistics
A moving statistic summarizes a data set using one value for each point in a data set. Each value is calculated over a sliding window of neighboring data points. Use a moving statistic when you want to identify local trends or smooth short-term noise (you can also smooth your data by using the smoothdata function). You can specify the sliding window size to control the number of neighboring data points included in each calculation.
For example, compute and visualize the moving maximum with a window of five elements. The returned vector of moving maxima has the same size as the sample data. The highest moving maximum value is the same as the global maximum value.
windowsize = 5;
yMovMax = movmax(y,windowsize)
yMovMax = 1×26

    0.9396    1.1907    1.1907    1.1907    1.1907    1.1907    1.0952    1.0151    1.0151    1.0151    1.0151    0.3883   -0.0411   -0.0411    0.0793    0.9410    1.2164    1.3931    1.3931    1.3931    1.3931    1.3931    1.1908    0.8001    0.8001    0.7120
plot(t,yMovMax,DisplayName="Moving max")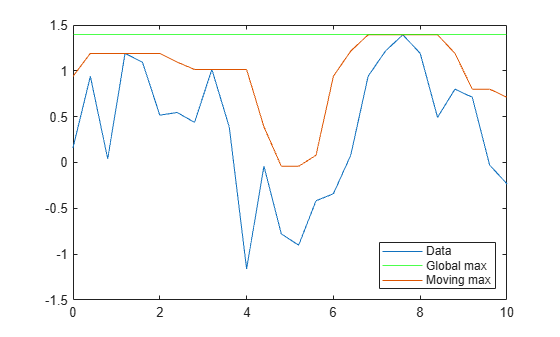
Cumulative Statistics
A cumulative statistic summarizes a data set using one value for each point in a data set. Each value is calculated from the beginning of your data up to each data point. Because a cumulative statistic describes how a statistic evolves over a data set, you can use a cumulative statistic when you want to track progress or identify when important events happen.
For example, compute and visualize the cumulative maximum. The returned vector of cumulative maxima is monotonically increasing and has the same size as the sample data. Once the cumulative maximum value reaches the global maximum value, those values remain equal for all subsequent data points.
yCumMax = cummax(y)
yCumMax = 1×26

    0.1613    0.9396    0.9396    1.1907    1.1907    1.1907    1.1907    1.1907    1.1907    1.1907    1.1907    1.1907    1.1907    1.1907    1.1907    1.1907    1.1907    1.1907    1.2164    1.3931    1.3931    1.3931    1.3931    1.3931    1.3931    1.3931
plot(t,yCumMax,DisplayName="Cumulative max")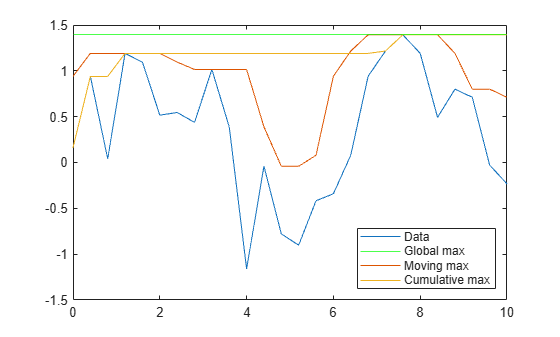
Local Extrema
Local extrema are data points that are higher (maxima) or lower (minima) than their neighboring data points. Local extrema help you find peaks and valleys and identify outliers in your data. Local extrema can be sensitive to noise. If you want to smooth your data before finding the local extrema, you can use the smoothdata function.
For example, compute and visualize the local maxima. The returned logical vector has elements of 1 (true) where a local maximum is detected in the corresponding element of y.
localMaxIdx = islocalmax(y)
localMaxIdx = 1×26 logical array

   0   1   0   1   0   0   1   0   1   0   0   1   0   0   0   0   0   0   0   1   0   0   1   0   0   0
scatter(t(localMaxIdx),y(localMaxIdx),DisplayName="Local maxima")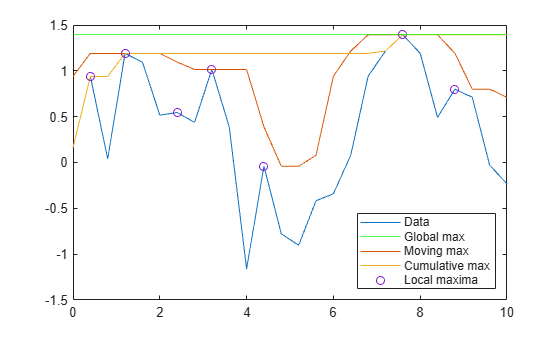
See Also
Functions
max|min|mean|movmax|movmin|movmean|cummax|islocalmax|islocalmin|smoothdata