lines
Arreglo del mapa de colores de líneas

Sintaxis
Descripción
c = lines devuelve el mapa de colores de líneas como un arreglo de tres columnas con el mismo número de filas que el mapa de colores de la figura actual (gcf). Si la figura no existe, el arreglo contiene 256 filas. Cada fila del arreglo contiene las intensidades roja, verde y azul para un color específico. Las intensidades están en el rango [0,1] y el esquema de color coincide con la propiedad ColorOrder predeterminada de Axes. Por lo tanto, puede utilizar este mapa de colores para hacer que los colores de la gráfica coincidan con la salida de la función plot.

Ejemplos
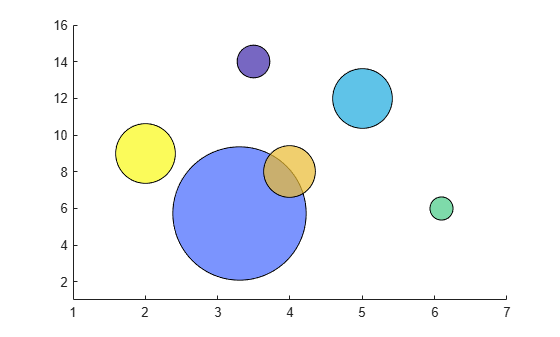
Cree un diagrama de dispersión usando los colores predeterminados.
x = [3.5 3.3 5 6.1 4 2];
y = [14 5.7 12 6 8 9];
sz = 100*[6 100 20 3 15 20];
c = [1 2 3 4 5 6];
scatter(x,y,sz,c,'filled','MarkerEdgeColor','k','MarkerFaceAlpha',.7);
xlim([1 7]);
ylim([1 16]);
Obtenga el arreglo del mapa de colores de líneas con seis entradas. A continuación, reemplace el mapa de colores en el diagrama de dispersión.
c = lines(6);
colormap(c);
