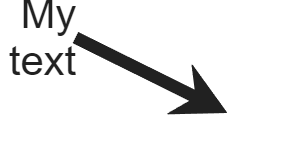
TextArrow
Text arrow annotation on figure
Description
Draw an arrow annotation with a text label anywhere on a figure. Set properties of
a TextArrow object to control its appearance.
Creation
Create a text arrow annotation on a figure using the annotation function.
annotation("textarrow",String="My text")
Alternatively, create a text arrow annotation by clicking the figure and selecting Text Arrow in the gallery on the Figure tab.
Properties
Text
Text rotation angle in degrees, specified as a scalar numeric value. Set this property to a positive value to rotate the text counterclockwise. Angles are absolute and not relative to previous rotations. A rotation of 0 degrees is always horizontal.
Example: 90
Text color, specified as a three-element RGB triplet, a hexadecimal color code, a
color name, or a short name. The default value of [0 0 0]
corresponds to black.
Note
Setting the Color property changes the
TextColor property to the same value, unless you explicitly set
the TextColor property.
For a custom color, specify an RGB triplet or a hexadecimal color code.
An RGB triplet is a three-element row vector whose elements specify the intensities of the red, green, and blue components of the color. The intensities must be in the range
[0,1], for example,[0.4 0.6 0.7].A hexadecimal color code is a string scalar or character vector that starts with a hash symbol (
#) followed by three or six hexadecimal digits, which can range from0toF. The values are not case sensitive. Therefore, the color codes"#FF8800","#ff8800","#F80", and"#f80"are equivalent.
Alternatively, you can specify some common colors by name. This table lists the named color options, the equivalent RGB triplets, and the hexadecimal color codes.
| Color Name | Short Name | RGB Triplet | Hexadecimal Color Code | Appearance |
|---|---|---|---|---|
"red" | "r" | [1 0 0] | "#FF0000" |
|
"green" | "g" | [0 1 0] | "#00FF00" |
|
"blue" | "b" | [0 0 1] | "#0000FF" |
|
"cyan"
| "c" | [0 1 1] | "#00FFFF" |
|
"magenta" | "m" | [1 0 1] | "#FF00FF" |
|
"yellow" | "y" | [1 1 0] | "#FFFF00" |
|
"black" | "k" | [0 0 0] | "#000000" |
|
"white" | "w" | [1 1 1] | "#FFFFFF" |
|
"none" | Not applicable | Not applicable | Not applicable | No color |
This table lists the default color palettes for plots in the light and dark themes.
| Palette | Palette Colors |
|---|---|
Before R2025a: Most plots use these colors by default. |
|
|
|
You can get the RGB triplets and hexadecimal color codes for these palettes using the orderedcolors and rgb2hex functions. For example, get the RGB triplets for the "gem" palette and convert them to hexadecimal color codes.
RGB = orderedcolors("gem");
H = rgb2hex(RGB);
Before R2023b: Get the RGB triplets using RGB =
get(groot,"FactoryAxesColorOrder").
Before R2024a: Get the hexadecimal color codes using H =
compose("#%02X%02X%02X",round(RGB*255)).
Example: "blue"
Example: [0 0 1]
Example: "#0000FF"
Color of text box outline, specified as a three-element RGB triplet, a hexadecimal color code, a color name, or a short name.
For a custom color, specify an RGB triplet or a hexadecimal color code.
An RGB triplet is a three-element row vector whose elements specify the intensities of the red, green, and blue components of the color. The intensities must be in the range
[0,1], for example,[0.4 0.6 0.7].A hexadecimal color code is a string scalar or character vector that starts with a hash symbol (
#) followed by three or six hexadecimal digits, which can range from0toF. The values are not case sensitive. Therefore, the color codes"#FF8800","#ff8800","#F80", and"#f80"are equivalent.
Alternatively, you can specify some common colors by name. This table lists the named color options, the equivalent RGB triplets, and the hexadecimal color codes.
| Color Name | Short Name | RGB Triplet | Hexadecimal Color Code | Appearance |
|---|---|---|---|---|
"red" | "r" | [1 0 0] | "#FF0000" |
|
"green" | "g" | [0 1 0] | "#00FF00" |
|
"blue" | "b" | [0 0 1] | "#0000FF" |
|
"cyan"
| "c" | [0 1 1] | "#00FFFF" |
|
"magenta" | "m" | [1 0 1] | "#FF00FF" |
|
"yellow" | "y" | [1 1 0] | "#FFFF00" |
|
"black" | "k" | [0 0 0] | "#000000" |
|
"white" | "w" | [1 1 1] | "#FFFFFF" |
|
"none" | Not applicable | Not applicable | Not applicable | No color |
This table lists the default color palettes for plots in the light and dark themes.
| Palette | Palette Colors |
|---|---|
Before R2025a: Most plots use these colors by default. |
|
|
|
You can get the RGB triplets and hexadecimal color codes for these palettes using the orderedcolors and rgb2hex functions. For example, get the RGB triplets for the "gem" palette and convert them to hexadecimal color codes.
RGB = orderedcolors("gem");
H = rgb2hex(RGB);
Before R2023b: Get the RGB triplets using RGB =
get(groot,"FactoryAxesColorOrder").
Before R2024a: Get the hexadecimal color codes using H =
compose("#%02X%02X%02X",round(RGB*255)).
Example: "blue"
Example: [0 0 1]
Example: "#0000FF"
Color of text box background, specified as an RGB triplet, a hexadecimal color code, a color name, or a short name.
For a custom color, specify an RGB triplet or a hexadecimal color code.
An RGB triplet is a three-element row vector whose elements specify the intensities of the red, green, and blue components of the color. The intensities must be in the range
[0,1], for example,[0.4 0.6 0.7].A hexadecimal color code is a string scalar or character vector that starts with a hash symbol (
#) followed by three or six hexadecimal digits, which can range from0toF. The values are not case sensitive. Therefore, the color codes"#FF8800","#ff8800","#F80", and"#f80"are equivalent.
Alternatively, you can specify some common colors by name. This table lists the named color options, the equivalent RGB triplets, and the hexadecimal color codes.
| Color Name | Short Name | RGB Triplet | Hexadecimal Color Code | Appearance |
|---|---|---|---|---|
"red" | "r" | [1 0 0] | "#FF0000" |
|
"green" | "g" | [0 1 0] | "#00FF00" |
|
"blue" | "b" | [0 0 1] | "#0000FF" |
|
"cyan"
| "c" | [0 1 1] | "#00FFFF" |
|
"magenta" | "m" | [1 0 1] | "#FF00FF" |
|
"yellow" | "y" | [1 1 0] | "#FFFF00" |
|
"black" | "k" | [0 0 0] | "#000000" |
|
"white" | "w" | [1 1 1] | "#FFFFFF" |
|
"none" | Not applicable | Not applicable | Not applicable | No color |
This table lists the default color palettes for plots in the light and dark themes.
| Palette | Palette Colors |
|---|---|
Before R2025a: Most plots use these colors by default. |
|
|
|
You can get the RGB triplets and hexadecimal color codes for these palettes using the orderedcolors and rgb2hex functions. For example, get the RGB triplets for the "gem" palette and convert them to hexadecimal color codes.
RGB = orderedcolors("gem");
H = rgb2hex(RGB);
Before R2023b: Get the RGB triplets using RGB =
get(groot,"FactoryAxesColorOrder").
Before R2024a: Get the hexadecimal color codes using H =
compose("#%02X%02X%02X",round(RGB*255)).
Example: "blue"
Example: [0 0 1]
Example: "#0000FF"
Width of text box outline, specified as a scalar numeric value in point units. One
point equals 1/72 inch.
Example: 1.5
Space around the text within the text box, specified as a scalar numeric value in pixel units.
Example: 10
LaTeX Markup
To use LaTeX markup, set the interpreter to "latex". For inline
mode, surround the markup with single dollar signs ($). For
display mode, surround the markup with double dollar signs
($$).
| LaTeX Mode | Example | Result |
|---|---|---|
| Inline |
"$\int_1^{20} x^2 dx$" |
|
| Display |
"$$\int_1^{20} x^2 dx$$" |
|


The displayed text uses the default LaTeX font style. The
FontName, FontWeight, and
FontAngle properties do not have an effect. To change the
font style, use LaTeX markup.
The maximum size of the text that you can use with the LaTeX interpreter is 1200 characters. For multiline text, this reduces by about 10 characters per line.
MATLAB supports most standard LaTeX math mode commands. For more information, see Supported LaTeX Commands. For examples that use TeX and LaTeX, see Greek Letters and Special Characters in Chart Text.
Font
Font size units, specified as one of the values in this table.
Units | Description |
|---|---|
"points" | Points. One point equals 1/72 inch. |
"inches" | Inches. |
"centimeters" | Centimeters. |
"normalized"
| Interpret font size as a fraction of the parent container height,
typically a figure. If you resize the container, the font size modifies
accordingly. For example, if the FontSize is
0.1 in normalized units, then the text is 1/10 of the
container height. |
"pixels" | Pixels. On Windows® and Macintosh systems, the size of a pixel is 1/96th of an inch. This size is independent of your system resolution. On Linux® systems, the size of a pixel is determined by your system resolution. |
If you set both the font size and the font units in one function call, you must
set the FontUnits property first so that the axes correctly
interprets the specified font size.
Arrow
Arrow color, specified as a three-element RGB triplet, a hexadecimal color code, a
color name, or a short name. The default value of [0 0 0]
corresponds to black.
Note
Setting this property also changes the text color if you have not explicitly set
the text color using the TextColor property.
For a custom color, specify an RGB triplet or a hexadecimal color code.
An RGB triplet is a three-element row vector whose elements specify the intensities of the red, green, and blue components of the color. The intensities must be in the range
[0,1], for example,[0.4 0.6 0.7].A hexadecimal color code is a string scalar or character vector that starts with a hash symbol (
#) followed by three or six hexadecimal digits, which can range from0toF. The values are not case sensitive. Therefore, the color codes"#FF8800","#ff8800","#F80", and"#f80"are equivalent.
Alternatively, you can specify some common colors by name. This table lists the named color options, the equivalent RGB triplets, and the hexadecimal color codes.
| Color Name | Short Name | RGB Triplet | Hexadecimal Color Code | Appearance |
|---|---|---|---|---|
"red" | "r" | [1 0 0] | "#FF0000" |
|
"green" | "g" | [0 1 0] | "#00FF00" |
|
"blue" | "b" | [0 0 1] | "#0000FF" |
|
"cyan"
| "c" | [0 1 1] | "#00FFFF" |
|
"magenta" | "m" | [1 0 1] | "#FF00FF" |
|
"yellow" | "y" | [1 1 0] | "#FFFF00" |
|
"black" | "k" | [0 0 0] | "#000000" |
|
"white" | "w" | [1 1 1] | "#FFFFFF" |
|
"none" | Not applicable | Not applicable | Not applicable | No color |
This table lists the default color palettes for plots in the light and dark themes.
| Palette | Palette Colors |
|---|---|
Before R2025a: Most plots use these colors by default. |
|
|
|
You can get the RGB triplets and hexadecimal color codes for these palettes using the orderedcolors and rgb2hex functions. For example, get the RGB triplets for the "gem" palette and convert them to hexadecimal color codes.
RGB = orderedcolors("gem");
H = rgb2hex(RGB);
Before R2023b: Get the RGB triplets using RGB =
get(groot,"FactoryAxesColorOrder").
Before R2024a: Get the hexadecimal color codes using H =
compose("#%02X%02X%02X",round(RGB*255)).
Example: "blue"
Example: [0 0 1]
Example: "#0000FF"
Style of arrow stem, specified as one of the line styles listed in this table.
| Line Style | Description | Resulting Line |
|---|---|---|
"-" | Solid line |
|
"--" | Dashed line |
|
":" | Dotted line |
|
"-." | Dash-dotted line |
|
"none" | No line | No line |
Width of arrow stem, specified as a scalar numeric value greater than zero in
point units. One point equals 1/72 inch. The default value is
0.5 points.
Example: 0.75
Style of the arrowhead, specified as one of the head style options in this table.
| Style | Result | Style | Result |
|---|---|---|---|
"plain" |
| "fourstar" |
|
"ellipse" |
| "rectangle" |
|
"vback1" |
| "diamond" |
|
"vback2" (default) |
| "rose" |
|
"vback3" |
| "hypocycloid" |
|
"cback1" |
| "astroid" |
|
"cback2" |
| "deltoid" |
|
"cback3" |
| "none" | No arrowhead |
Length of the arrowhead, specified as a scalar numeric value in point units. One
point equals 1/72 inch.
Example: 15
Width of the arrowhead, specified as a scalar numeric value in point units. One
point equals 1/72 inch.
Example: 15
Position
Beginning and ending x-coordinates for the arrow, specified
as a two-element vector of the form [x_begin x_end].
By default, the units are normalized to the figure. The lower-left corner of the
figure maps to (0,0), and the upper-right corner maps to
(1,1). To change the units, use the Units
property.
Example: [0.2 0.3]
Beginning and ending y-coordinates for the arrow, specified
as a two-element vector of the form [y_begin y_end].
By default, the units are normalized to the figure. The lower-left corner of the
figure maps to (0,0), and the upper-right corner maps to
(1,1). To change the units, use the Units
property.
Example: [0.2 0.3]
Size and location, specified as a four-element vector of the form
[x_begin y_begin length height]. The first two elements specify
the coordinates of the beginning of the arrow. The second two elements specify the
length and height of the arrow. The text box extends from the beginning of the
arrow.
By default, the units are normalized to the figure. The lower-left corner of the
figure maps to (0,0), and the upper-right corner maps to
(1,1). To change the units, use the Units
property.
Example: [0.2 0.2 0.3 0.1]
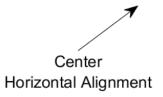
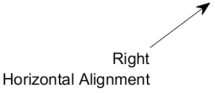
Horizontal alignment of the text, specified as one of the values in this table. This property is useful when aligning multiple lines of text.
| Value | Result |
|---|---|
"left"
|
|
"center" |
|
"right" |
|

Vertical alignment of the text with respect to the end of the arrow, specified as
"top", "cap", "middle",
"baseline", or "bottom".
Examples
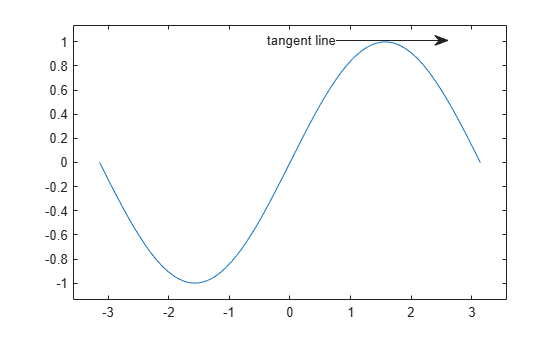
Create a text arrow annotation on a figure. Specify the horizontal range of the arrow stem using the form [x_begin x_end] and vertical range of the arrow stem using the form [y_begin y_end]. By default, the units are normalized to the figure. So, the lower-left corner of the figure maps to (0,0) and the upper-right corner maps to (1,1).
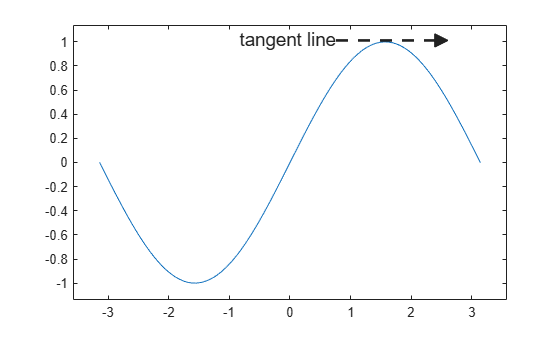
x = linspace(-pi,pi);
y = sin(x);
plot(x,y)
axis padded

xint = [0.60 0.80];
yint = [0.88 0.88];
annotation("textarrow",xint,yint,String="tangent line");
Create a text arrow annotation on a figure. Customize the text arrow by setting the line width, line style, arrowhead style, and font size.
x = linspace(-pi,pi);
y = sin(x);
plot(x,y)
axis padded

xint = [0.60 0.80];
yint = [0.88 0.88];
an = annotation("textarrow",xint,yint,String="tangent line");
an.LineWidth = 2;
an.LineStyle = "--";
an.HeadStyle = "plain";
an.FontSize = 14;
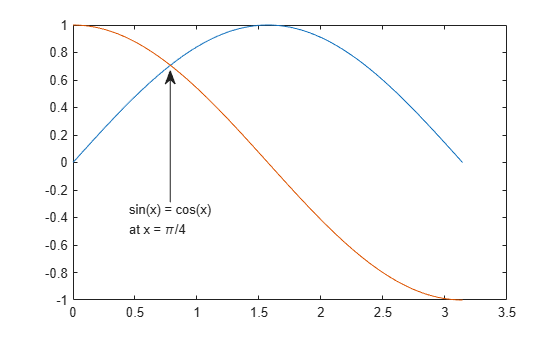
Create a text arrow annotation that has multiple lines of text by specifying a string array.
x = linspace(0,pi);
y1 = sin(x);
plot(x,y1)
hold on
y2 = cos(x);
plot(x,y2)
hold off

xint = [0.304 0.304];
yint = [0.40 0.79];
arrowlabel = ["sin(x) = cos(x)" "at x = \pi/4"];
annotation("textarrow",xint,yint,String=arrowlabel);
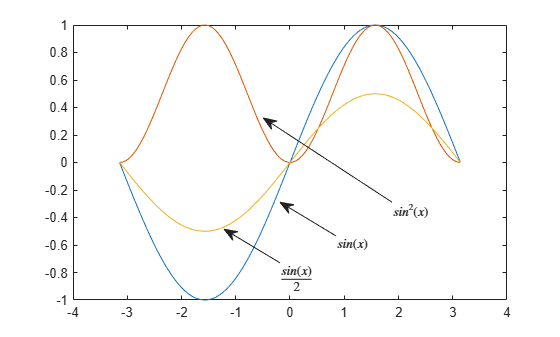
Create a text arrow annotation that uses LaTeX equations. To add inline equations using LaTeX, surround the text with single dollar signs ($). Then set the text interpreter to "latex".
x = linspace(-pi,pi);
y1 = sin(x);
plot(x,y1)
hold on
y2 = sin(x).^2;
plot(x,y2)
y3 = sin(x)/2;
plot(x,y3)
hold off

xint1 = [0.60 0.50];
yint1 = [0.30 0.40];
an1 = annotation("textarrow",xint1,yint1,String="$sin(x)$");
an1.Interpreter = "latex";
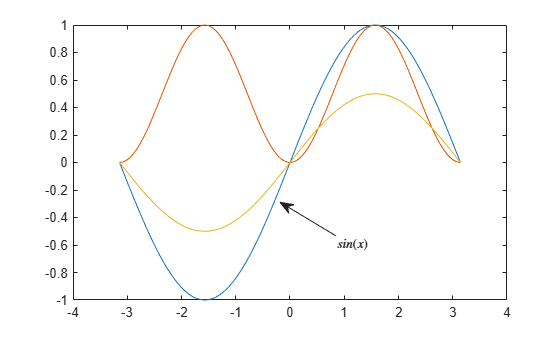
On the same figure, create two more text arrow annotations that use LaTeX equations.
xint2 = [0.70 0.47];
yint2 = [0.40 0.65];
an2 = annotation("textarrow",xint2,yint2,String="$sin^2(x)$");
an2.Interpreter = "latex";

xint3 = [0.50 0.40];
yint3 = [0.22 0.32];
an3 = annotation("textarrow",xint3,yint3,String="$\frac{sin(x)}{2}$");
an3.Interpreter = "latex";
Create three text arrow annotations on a figure. By default, the text is horizontal.
x = linspace(1,4);
y1 = x;
plot(x,y1)
hold on
y2 = x.^2;
plot(x,y2)
y3 = x.^3;
plot(x,y3)
hold off

xint1 = [0.65 0.90];
yint1 = [0.16 0.18];
an1 = annotation("textarrow",xint1,yint1,String="linear");

xint2 = [0.68 0.90];
yint2 = [0.24 0.33];
an2 = annotation("textarrow",xint2,yint2,String="quadratic");

xint3 = [0.62 0.90];
yint3 = [0.41 0.90];
an3 = annotation("textarrow",xint3,yint3,String="cubic");
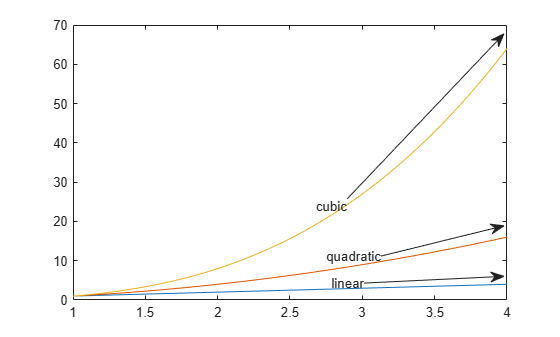
Rotate the text counterclockwise by specifying the degree of the text rotation. Further adjust the third arrow by vertically aligning the text with the end of the arrow.
an1.TextRotation = 1;
an2.TextRotation = 8;
an3.TextRotation = 33;
an3.VerticalAlignment = "middle";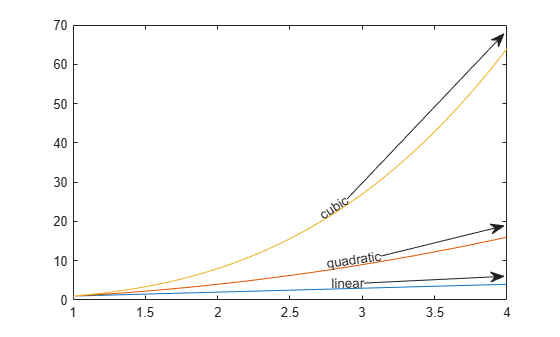
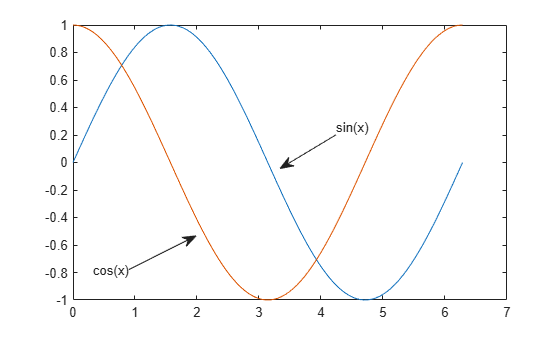
Create two text arrow annotations on a figure. By default, the text is aligned with the top left of the text box, and the text box outline and background are not visible.
x = linspace(0,2*pi);
y1 = sin(x);
plot(x,y1)
hold on
y2 = cos(x);
plot(x,y2)
hold off

xint1 = [0.60 0.50];
yint1 = [0.60 0.50];
an1 = annotation("textarrow",xint1,yint1,String="sin(x)");

xint2 = [0.23 0.35];
yint2 = [0.20 0.30];
an2 = annotation("textarrow",xint2,yint2,String="cos(x)");
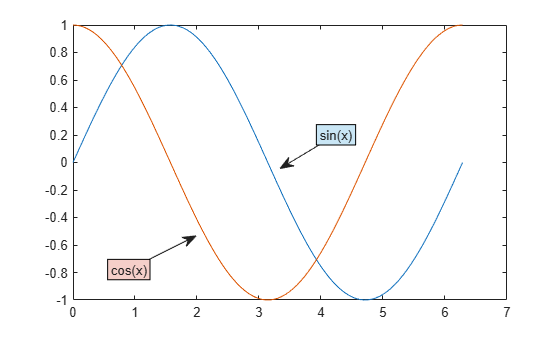
Set the vertical and horizontal alignment so that the text is centered. Change the background color and the outline color of the text box.
an1.VerticalAlignment = "middle";
an1.HorizontalAlignment = "center";
an1.TextBackgroundColor = [0.79 0.90 0.96];
an1.TextEdgeColor = "k";

an2.VerticalAlignment = "middle";
an2.HorizontalAlignment = "center";
an2.TextBackgroundColor = [0.96 0.81 0.79];
an2.TextEdgeColor = "k";
Version History
Introduced before R2006a