tiledlayout
Crear diseños de gráfica en mosaico para mostrar subgráficas
Sintaxis
Descripción
tiledlayout crea un diseño de gráfica en mosaico para mostrar varias gráficas, también llamadas subgráficas, en la figura actual. El diseño puede mostrar cualquier número de gráficas y reordenarse en función del tamaño de la figura y el número de ejes. Si no hay figura, MATLAB® crea una figura y coloca el diseño en ella. Si la figura actual contiene un diseño o ejes existentes, MATLAB la sustituye con un nuevo diseño. (desde R2024b)
Un diseño de gráfica en mosaico contiene una cuadrícula invisible de mosaicos que cubre toda la figura o contenedor principal. Cada mosaico puede contener un objeto de ejes para mostrar una gráfica. Después de crear un diseño, llame a la función nexttile para colocar un objeto de ejes en el diseño. Después llame a una función de representación que representar en los ejes.
tiledlayout( crea un diseño que puede contener cualquier número de ejes. Inicialmente, solo hay un mosaico vacío que rellena el diseño completo. Especifique un valor de disposición para controlar la colocación de los siguientes ejes:arrangement)
"flow": crea un diseño para una cuadrícula de ejes que puede reordenarse dependiendo del tamaño de la figura y del número de ejes."vertical": crea un diseño para una pila vertical de ejes. (desde R2023a)"horizontal": crea un diseño para una pila horizontal de ejes. (desde R2023a)
Puede especificar el argumento arrangement sin paréntesis. Por ejemplo, tiledlayout vertical crea un diseño para una pila vertical de ejes.
tiledlayout(___, especifica opciones adicionales para el diseño utilizando uno o más argumentos de par nombre-valor. Especifique las opciones después de todos los demás argumentos de entrada. Por ejemplo, Name,Value)tiledlayout(2,2,"TileSpacing","compact") crea un diseño de 2 por 2 con espaciado mínimo entre los mosaicos. Para obtener una lista de las propiedades, consulte TiledChartLayout Properties.
tiledlayout( crea el diseño en el contenedor principal especificado en lugar de en la figura actual. Especifique el contenedor principal antes de todos los demás argumentos de entrada.parent,___)
t = tiledlayout(___) devuelve el objeto TiledChartLayout. Use t para configurar las propiedades del diseño después de crearlo.
Ejemplos
Cree un diseño de gráfica en mosaico de 2 por 2 y llame a la función peaks para obtener las coordenadas de una superficie predefinida. Cree un objeto de ejes en el primer mosaico llamando a la función nexttile. Después, llame a la función surf para representarla en los ejes. Repita el proceso usando diferentes funciones de representación para los otros tres mosaicos.
tiledlayout(2,2);
[X,Y,Z] = peaks(20);

% Tile 1
nexttile
surf(X,Y,Z)

% Tile 2
nexttile
contour(X,Y,Z)

% Tile 3
nexttile
imagesc(Z)

% Tile 4
nexttile
plot3(X,Y,Z)

Desde R2024b
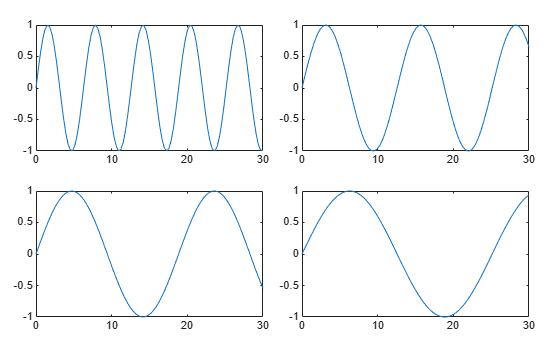
Cree cuatro vectores de coordenadas: x, y1, y2 e y3.
x = linspace(0,30);
y1 = sin(x/2);
y2 = sin(x/3);
y3 = sin(x/4);
Para crear un diseño de gráfica en mosaico que pueda dar cabida a cualquier número de gráficas, llame a la función tiledlayout sin argumentos de entrada. (También puede utilizar el comando tiledlayout("flow"), que produce el mismo resultado).
Cree los primeros ejes llamando a la función nexttile. Después, represente y1 con respecto a x en los ejes y añada un mosaico. Esta gráfica rellena el diseño completo.
tiledlayout
nexttile
plot(x,y1)
title("Plot of sin(x/2)")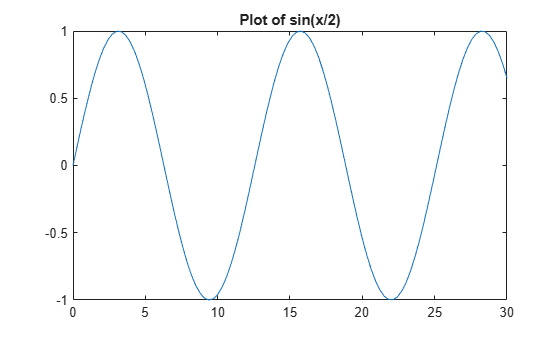
Cree un segundo mosaico y ejes, y represente en los ejes.
nexttile
plot(x,y2)
title("Plot of sin(x/3)")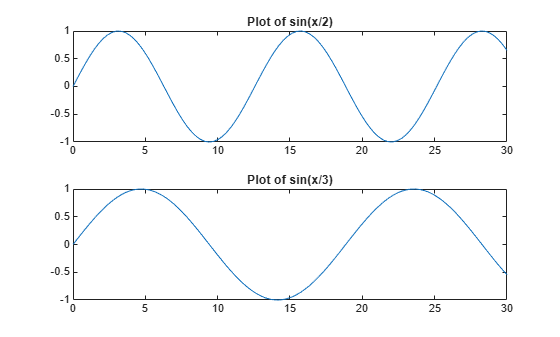
Repita el proceso para crear una tercera gráfica.
nexttile
plot(x,y3)
title("Plot of sin(x/4)")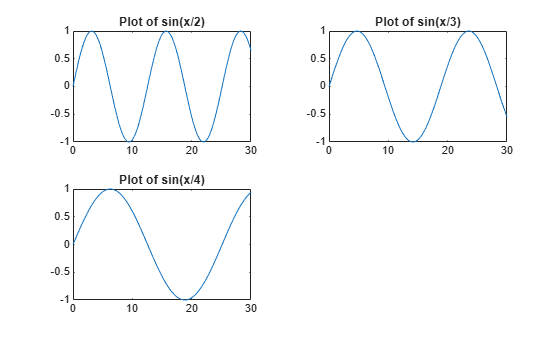
Repita el proceso para crear una cuarta gráfica. Esta vez, represente las tres líneas en el mismo eje llamando a hold on después de representar y1.
nexttile
plot(x,y1)
hold on
plot(x,y2)
plot(x,y3)
title("Three Sine Waves")
hold off

Cree un diseño de gráfica en mosaico que tenga una pila vertical de gráficas especificando la opción "vertical" cuando llame a la función tiledlayout. Después, cree tres gráficas llamando a la función nexttile seguida de una función de representación. Cada vez que llama a nexttile, se añade un nuevo objeto de ejes a la parte inferior de la pila.
tiledlayout("vertical")
x = 0:0.1:5;
nexttile
plot(x,sin(x))
nexttile
plot(x,sin(x+1))
nexttile
plot(x,sin(x+2))
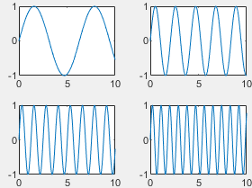
Cree un diseño de gráfica en mosaico que tenga una pila horizontal de gráficas especificando la opción "horizontal" cuando llame a la función tiledlayout. Después, cree tres gráficas llamando a la función nexttile seguida de una función de representación. Cada vez que llama a nexttile, se añade un nuevo objeto de ejes al lado derecho de la pila.
tiledlayout("horizontal")
x = 0:0.1:10;
nexttile
plot(x,sin(x/2))
nexttile
plot(x,sin(x))
nexttile
plot(x,sin(2*x))
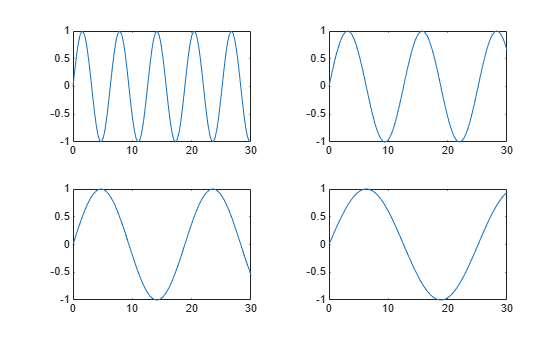
Cree cinco vectores de coordenadas: x, y1, y2, y3 e y4. Después, llame a la función tiledlayout para crear un diseño de 2 por 2 y especifique un argumento de retorno para almacenar el objeto TileChartLayout. Llame a la función nexttile para crear un objeto de ejes en el siguiente mosaico vacío antes de llamar a la función plot.
x = linspace(0,30);
y1 = sin(x);
y2 = sin(x/2);
y3 = sin(x/3);
y4 = sin(x/4);
t = tiledlayout(2,2);

% Tile 1
nexttile
plot(x,y1)

% Tile 2
nexttile
plot(x,y2)

% Tile 3
nexttile
plot(x,y3)

% Tile 4
nexttile
plot(x,y4)
Reduzca la cantidad de espacio entre los mosaicos estableciendo la propiedad TileSpacing en 'compact'. Después, reduzca el espacio entre los bordes del diseño y los bordes de la figura estableciendo la propiedad Padding en 'compact'.
t.TileSpacing = 'compact';
t.Padding = 'compact';
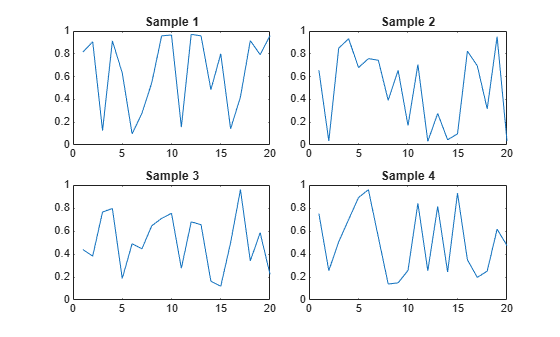
Cree un diseño de gráfica segmentado t de 2 por 2. Especifique el argumento de par nombre-valor TileSpacing para minimizar el espacio entre los mosaicos. Después, cree una gráfica con título en cada mosaico.
t = tiledlayout(2,2,'TileSpacing','Compact');

% Tile 1
nexttile
plot(rand(1,20))
title('Sample 1')

% Tile 2
nexttile
plot(rand(1,20))
title('Sample 2')

% Tile 3
nexttile
plot(rand(1,20))
title('Sample 3')

% Tile 4
nexttile
plot(rand(1,20))
title('Sample 4')
Muestre un título y etiquetas de eje compartidos pasando t a las funciones title, xlabel e ylabel.
title(t,'Size vs. Distance')
xlabel(t,'Distance (mm)')
ylabel(t,'Size (mm)')

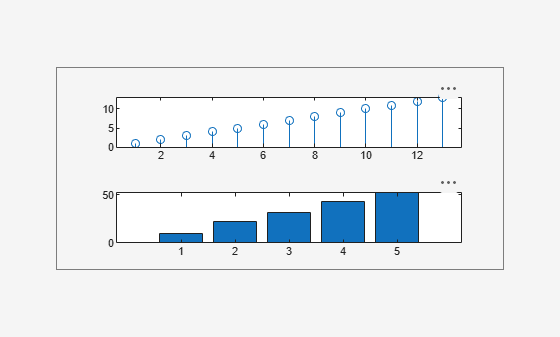
Cree un panel en una figura. Después, cree un diseño de gráfica en mosaico en el panel especificando el objeto de panel como primer argumento para la función tiledlayout. Muestre una gráfica en cada mosaico.
p = uipanel('Position',[.1 .2 .8 .6]);
t = tiledlayout(p,2,1);

% Tile 1
nexttile(t)
stem(1:13)

% Tile 2
nexttile(t)
bar([10 22 31 43 52])
Llame a la función tiledlayout para crear un diseño de gráfica en mosaico de 2 por 1. Llame a la función nexttile con un argumento de salida para almacenar los ejes. Después, represéntelo en los ejes y establezca los colores del eje x e y en rojo. Repita el proceso en el segundo mosaico.
t = tiledlayout(2,1);

% First tile
ax1 = nexttile;
plot([1 2 3 4 5],[11 6 10 4 18]);
ax1.XColor = [1 0 0];
ax1.YColor = [1 0 0];

% Second tile
ax2 = nexttile;
plot([1 2 3 4 5],[5 1 12 9 2],'o');
ax2.XColor = [1 0 0];
ax2.YColor = [1 0 0];

Defina scores y strikes como vectores que contienen datos de cuatro partidos de una liga de bolos. Después, cree un diseño de gráfica en mosaico y muestre tres gráficas que muestren el número de plenos de cada equipo.
scores = [444 460 380
          387 366 500
          365 451 611
          548 412 452];

strikes = [9  6  5
           6  4  8
           4  7  16
           10 9  8];

t = tiledlayout('flow');

% Team 1
nexttile
plot([1 2 3 4],strikes(:,1),'-o')
title('Team 1 Strikes')

% Team 2
nexttile
plot([1 2 3 4],strikes(:,2),'-o')
title('Team 2 Strikes')

% Team 3
nexttile
plot([1 2 3 4],strikes(:,3),'-o')
title('Team 3 Strikes')
Llame a la función nexttile para crear un objeto de ejes que abarque dos filas por tres columnas. Después, muestre una gráfica de barras en los ejes con una leyenda y configure las etiquetas y los valores de marcas del eje. Llame a la función title para añadir un mosaico al diseño.
nexttile([2 3]);
bar([1 2 3 4],scores)
legend('Team 1','Team 2','Team 3','Location','northwest')

% Configure ticks and axis labels
xticks([1 2 3 4])
xlabel('Game')
ylabel('Score')

% Add layout title
title(t,'April Bowling League Data')

Para abarcar un objeto de ejes desde una ubicación concreta, especifique el número de mosaicos y el valor del intervalo.
Defina scores y strikes como vectores que contienen datos de cuatro partidos de una liga de bolos. Después, cree un diseño de gráfica en mosaico de 3 por 3 y muestre cinco gráficas de barras que muestren el número de plenos para cada equipo.
scores = [444 460 380 388 389
          387 366 500 467 460
          365 451 611 426 495
          548 412 452 471 402];

strikes = [9  6  5  7  5
           6  4  8 10  7
           4  7 16  9  9
           10  9  8  8  9];

t = tiledlayout(3,3);

% Team 1
nexttile
bar([1 2 3 4],strikes(:,1))
title('Team 1 Strikes')

% Team 2
nexttile
bar([1 2 3 4],strikes(:,2))
title('Team 2 Strikes')

% Team 3
nexttile
bar([1 2 3 4],strikes(:,3))
title('Team 3 Strikes')

% Team 4
nexttile
bar([1 2 3 4],strikes(:,4))
title('Team 4 Strikes')

% Team 5
nexttile(7)
bar([1 2 3 4],strikes(:,5))
title('Team 5 Strikes')
Muestre una gráfica más grande con una leyenda. Llame a la función nexttile para colocar la esquina superior izquierda de los ejes en el quinto mosaico y abarque los ejes a lo largo de dos filas y dos columnas de mosaicos. Represente las puntuaciones de todos los equipos. Configure el eje x para mostrar cuatro marcas y añada etiquetas a cada eje. Después, añada un título compartido en la parte superior del diseño.
nexttile(5,[2 2]);
plot([1 2 3 4],scores,'-.')
labels = {'Team 1','Team 2','Team 3','Team 4','Team 5'};
legend(labels,'Location','northwest')

% Configure ticks and axis labels
xticks([1 2 3 4])
xlabel('Game')
ylabel('Score')

% Add layout title
title(t,'April Bowling League Data')

Cree un diseño de gráfica en mosaico de 1 por 2. En el primer mosaico, muestre una gráfica geográfica que contenga una línea que conecte dos ciudades de un mapa. En el segundo mosaico, cree un diagrama de dispersión en coordenadas polares.
tiledlayout(1,2)

% Display geographic plot
nexttile
geoplot([47.62 61.20],[-122.33 -149.90],'g-*')

% Display polar plot
nexttile
theta = pi/4:pi/4:2*pi;
rho = [19 6 12 18 16 11 15 15];
polarscatter(theta,rho)

Una de las formas en que el argumento de salida nexttile es útil es cuando desea ajustar el contenido de un mosaico anterior. Por ejemplo, imagine que decide volver a configurar el mapa de colores utilizado en una gráfica anterior.
Cree un diseño de gráfica en mosaico de 2 por 2. Llame a la función peaks para obtener las coordenadas de una superficie predefinida. Después, cree una gráfica diferente de la superficie de cada mosaico.
tiledlayout(2,2);
[X,Y,Z] = peaks(20);

% Tile 1
nexttile
surf(X,Y,Z)

% Tile 2
nexttile
contour(X,Y,Z)

% Tile 3
nexttile
imagesc(Z)

% Tile 4
nexttile
plot3(X,Y,Z)

Para cambiar el mapa de colores del tercer mosaico, obtenga los ejes de ese mosaico. Llame a la función nexttile especificando el número de mosaico y devuelva el argumento de salida de los ejes. Después, pase los ejes a la función colormap.
ax = nexttile(3);
colormap(ax,cool)

Cree un diseño de gráfica en mosaico de 2 por 3 que contenga dos gráficas en mosaicos individuales y una gráfica que abarque dos filas y dos columnas.
t = tiledlayout(2,3);
[X,Y,Z] = peaks;

% Tile 1
nexttile
contour(X,Y,Z)

% Span across two rows and columns
nexttile([2 2])
contourf(X,Y,Z)

% Last tile
nexttile
imagesc(Z)

Para cambiar el mapa de colores de los ejes abarcados, identifique la ubicación del mosaico como una que contenga la esquina superior izquierda de los ejes. En este caso, la esquina superior izquierda está en el segundo mosaico. Llame a la función nexttile con 2 como ubicación del mosaico y especifique un argumento de salida para devolver el objeto de ejes en esa ubicación. Después, pase los ejes a la función colormap.
ax = nexttile(2);
colormap(ax,hot)

Cargue el conjunto de datos patients y cree una tabla a partir de un subconjunto de las variables. Después, cree un diseño de gráfica en mosaico de 2 por 2. Muestre un diagrama de dispersión en el primer mosaico, un mapa de calor en el segundo mosaico y una gráfica apilada en los dos mosaicos inferiores.
load patients
tbl = table(Diastolic,Smoker,Systolic,Height,Weight,SelfAssessedHealthStatus);
tiledlayout(2,2)

% Scatter plot
nexttile
scatter(tbl.Height,tbl.Weight)

% Heatmap
nexttile
heatmap(tbl,'Smoker','SelfAssessedHealthStatus','Title','Smoker''s Health');

% Stacked plot
nexttile([1 2])
stackedplot(tbl,{'Systolic','Diastolic'});

Llame a nexttile y especifique el número de mosaico como 1 para convertir los ejes de ese mosaico en los ejes actuales. Sustituya el contenido de ese mosaico con un histograma de dispersión.
nexttile(1)
scatterhistogram(tbl,'Height','Weight');

Cuando desee compartir una barra de colores o leyenda entre dos o más gráficas, puede colocarla en un mosaico separado.
Cree diagramas de contorno rellenos de los conjuntos de datos peaks y membrane en un diseño de gráfica en mosaico.
Z1 = peaks;
Z2 = membrane;
tiledlayout(2,1);
nexttile
contourf(Z1)
nexttile
contourf(Z2)

Añada una barra de colores y muévala al mosaico este.
cb = colorbar;
cb.Layout.Tile = 'east';
De manera ocasional, es posible que necesite crear los ejes llamando a una de las funciones de ejes (axes, polaraxes o geoaxes). Cuando cree los ejes con una de estas funciones, especifique el argumento parent como el diseño de gráfica en mosaico. Después, coloque los ejes estableciendo la propiedad Layout de los ejes.
Cree un diseño de gráfica en mosaico t y especifique la disposición de mosaicos 'flow'. Muestre una gráfica en cada uno de los tres mosaicos.
t = tiledlayout('flow');
nexttile
plot(rand(1,10));
nexttile
plot(rand(1,10));
nexttile
plot(rand(1,10));
Cree un objeto de ejes geográficos gax llamando a la función geoaxes y especifique t como el argumento principal. De forma predeterminada, los ejes van en el primer mosaico, de modo que muévalos al cuarto mosaico estableciendo gax.Layout.Tile en 4. Abarque los ejes a lo largo de una región 2 por 3 de mosaicos estableciendo gax.Layout.TileSpan en [2 3].
gax = geoaxes(t);
gax.Layout.Tile = 4;
gax.Layout.TileSpan = [2 3];

Llame a la función geoplot. Después, configure el centro del mapa y el nivel de zoom para los ejes.
geoplot(gax,[47.62 61.20],[-122.33 -149.90],'g-*')
gax.MapCenter = [47.62 -122.33];
gax.ZoomLevel = 2;
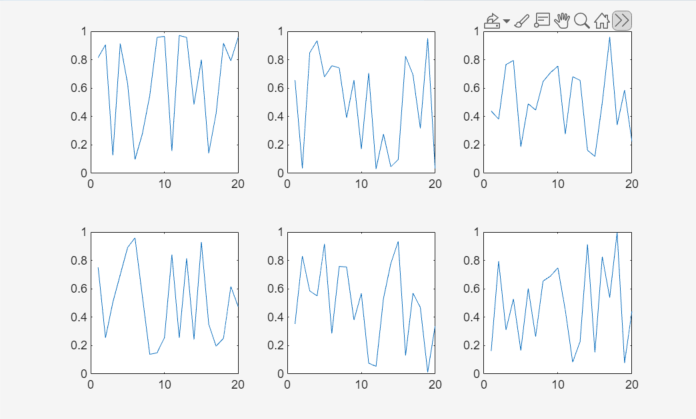
Cree un diseño de gráfica en mosaico para mostrar seis gráficas de datos aleatorios. Para crear una barra de herramientas de los ejes compartida, llame a la función axtoolbar con el objeto de diseño de gráfica en mosaico como primer argumento.
tcl = tiledlayout;
tb = axtoolbar(tcl, {"export","pan","zoom","datacursor","brush","restoreview"}, Expanded="on");

for i = 1:6
    nexttile
    plot(rand(20,1))
end
Argumentos de entrada
Argumentos de par nombre-valor
Especifique pares opcionales de argumentos como Name1=Value1,...,NameN=ValueN, donde Name es el nombre del argumento y Value es el valor correspondiente. Los argumentos nombre-valor deben aparecer después de otros argumentos, pero el orden de los pares no importa.
Ejemplo: tiledlayout(2,2,"TileSpacing","compact") crea un diseño de 2 por 2 que tiene espaciado mínimo entre los mosaicos.
Nota
Las propiedades que se enumeran aquí son solo un subconjunto. Para obtener una lista completa, consulte TiledChartLayout Properties.
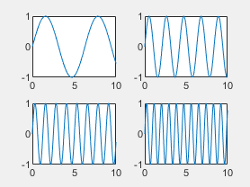
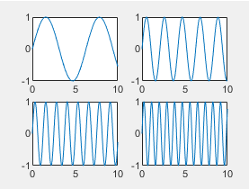
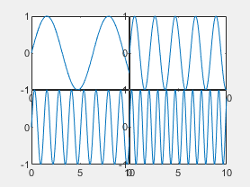
Espaciado de mosaicos, especificado como "loose", "compact", "tight" o "none". Use esta propiedad para controlar el espaciado entre los mosaicos.
Esta tabla muestra cómo afecta cada valor al aspecto de un diseño de 2 por 2.
| Valor | Apariencia |
|---|---|
|
|
"compact" |
|
"tight" |
|
"none" |
|

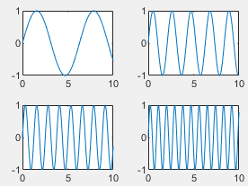
Relleno alrededor del perímetro del diseño, especificado como "loose", "compact" o "tight". El diseño proporciona espacio para todas las decoraciones, como etiquetas de eje, independientemente del valor de esta propiedad.
Esta tabla muestra cómo afecta cada valor al aspecto de un diseño de 2 por 2.
| Valor | Apariencia |
|---|---|
|
|
"compact" |
|
"tight" |
|
Historial de versiones
Introducido en R2019bCuando crea un diseño de gráfica en mosaico, algunas de las propiedades TileSpacing y Padding proporcionan un resultado diferente o tienen nuevos nombres.
Las nuevas opciones de TileSpacing son "loose", "compact", "tight" y "none". Las nuevas opciones de Padding son "loose", "compact" y "tight". Las siguientes tablas describen cómo están relacionadas las opciones anteriores con las nuevas.
Cambios en TileSpacing
Opción de TileSpacing anterior | Opción de TileSpacing en la versión R2021a | Cómo actualizar el código |
|---|---|---|
|
| Considere cambiar las instancias de Ya no se recomienda la opción |
|
| No es necesario hacer cambios. |
| No se aplica |
|
|
|
| La opción Para conservar el espaciado entre los cuadros de gráficas, cambie las instancias de |
Cambios en Padding
Opción de Padding anterior | Opción de Padding en la versión R2021a | Cómo actualizar el código |
|---|---|---|
|
| Considere cambiar las instancias de Ya no se recomienda la opción |
|
| No es necesario hacer cambios. |
|
| Considere cambiar las instancias de Ya no se recomienda la opción |