pdepoly
R2026bDraw polygon in PDE Modeler app
Description
pdepoly( draws
a polygon with the corner coordinates (vertices) defined by X,Y)X
and Y. The pdepoly command opens the PDE
Modeler app with the specified polygon drawn in it. If the app is already open,
pdepoly adds the specified polygon to the app window without
deleting any existing shapes.
pdepoly updates the state of the geometry description matrix
inside the PDE Modeler app to include the polygon. You can export the geometry
description matrix from the PDE Modeler app to the MATLAB® Workspace by selecting
DrawExport Geometry Description, Set
Formula, Labels.... For details on the format of the geometry
description matrix, see decsg.
Examples
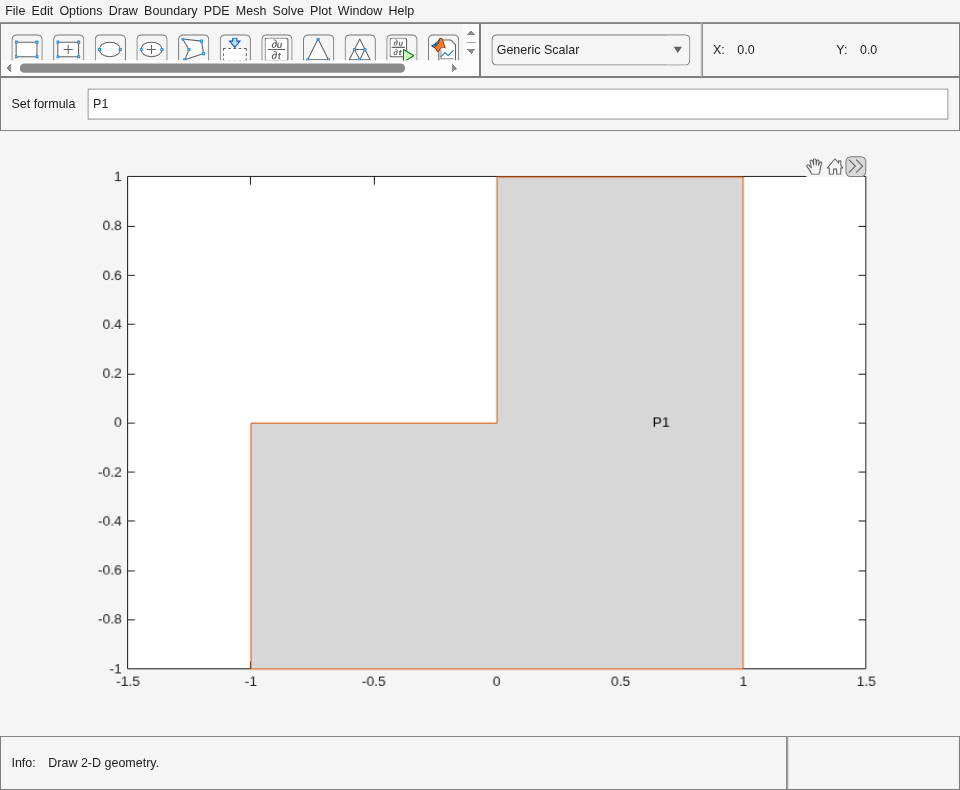
Open the PDE Modeler app window containing a polygon representing the L-shaped membrane geometry.
pdepoly([-1 0 0 1 1 -1],[0 0 1 1 -1
                        -1])
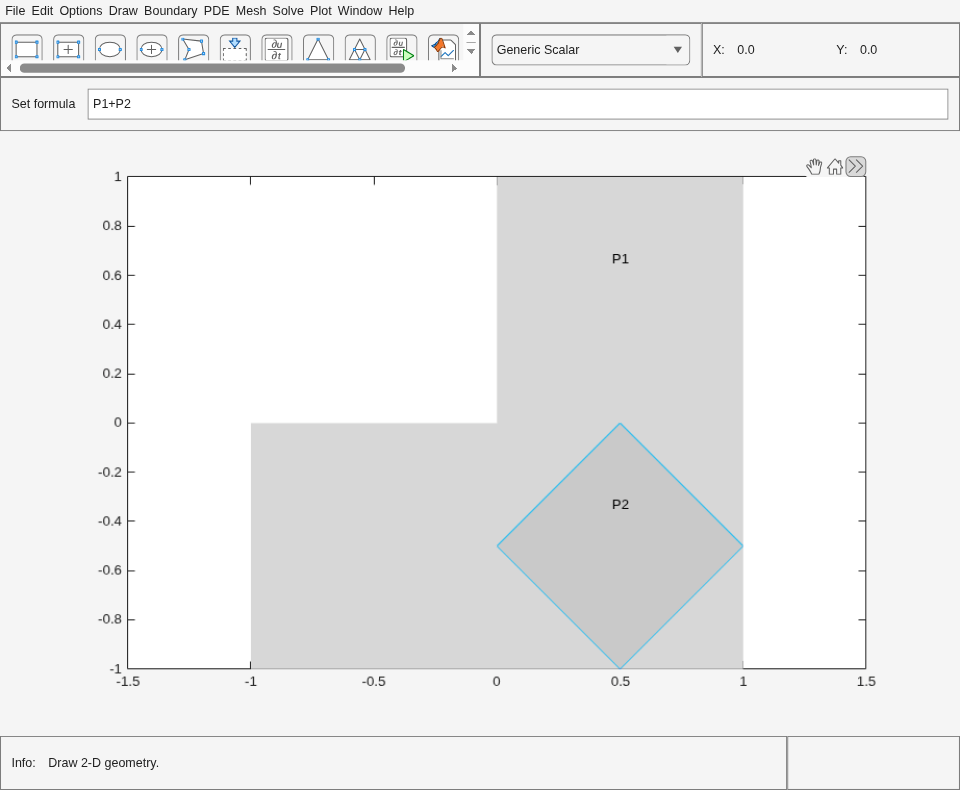
Call the pdepoly command again to draw the diamond-shaped region with corners in (0.5,0), (1,-0.5), (0.5,-1), and (0,-0.5). The pdepoly command adds the second polygon to the app window without deleting the first.
pdepoly([0.5 1 0.5 0],[0 -0.5 -1 -0.5])
Open the PDE Modeler app window with a polygon representing the L-shaped membrane geometry. Assign the name L-shaped-membrane to this polygon.
pdepoly([-1 0 0 1 1 -1],[0 0 1 1 -1 -1],"L-shaped-membrane")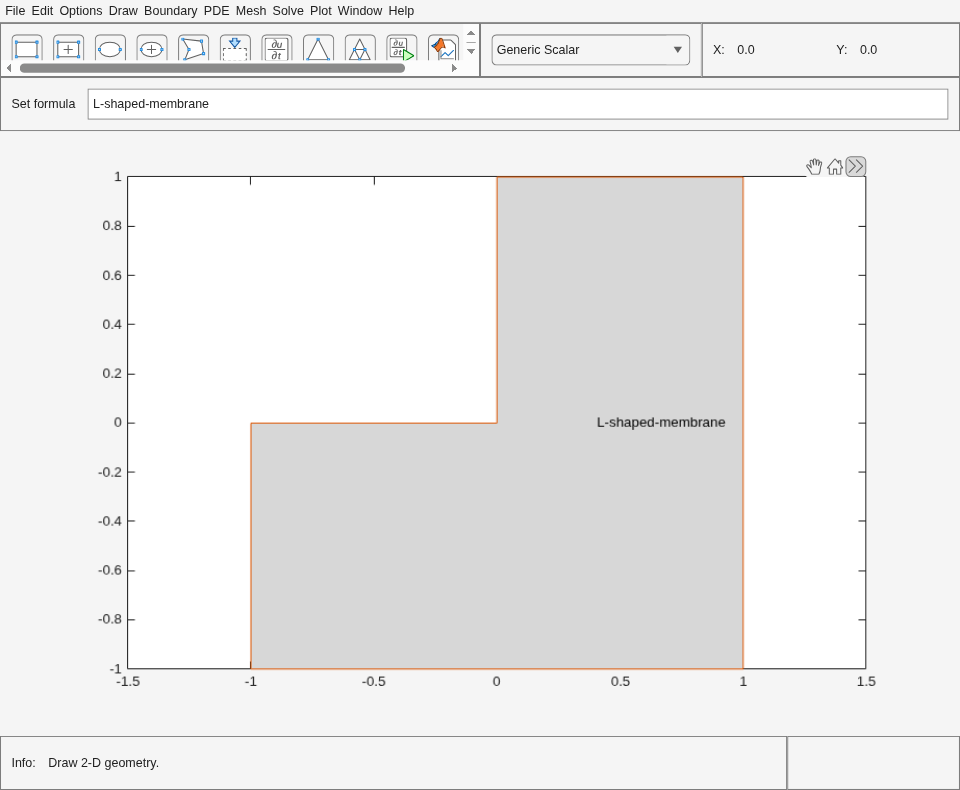
Input Arguments
Tips
pdepolyopens the PDE Modeler app and draws a polygon. If, instead, you want to draw polygons in a MATLAB figure, use theplotfunction, for example:x = [-1,-0.5,-0.5,0,1.5,-0.5,-1]; y = [-1,-1,-0.5,0,0.5,0.9,-1]; plot(x,y,'.-')
Version History
Introduced before R2006a
See Also
pdecirc | pdeellip | pderect | PDE
Modeler

