Contenido principal

phased.HeterogeneousURA

Heterogeneous uniform rectangular array

Description

The HeterogeneousURA object constructs a heterogeneous uniform rectangular array (URA).

To compute the response for each element in the array for specified directions:

  1. Create the phased.HeterogeneousURA object and set its properties.

  2. Call the object with arguments, as if it were a function.

To learn more about how System objects work, see What Are System Objects?

Creation

Description

array = phased.HeterogeneousURA creates a heterogeneous uniform rectangular array (URA) System object™, array. This object models a heterogeneous URA formed with sensor elements whose pattern may vary from element to element. Array elements are distributed in the yz-plane in a rectangular lattice. An M-by-N heterogeneous URA has M rows and N columns. The array boresight direction is along the positive x-axis. The default array is a 2-by-2 URA of isotropic antenna elements.

array = phased.HeterogeneousURA(Name="Value") creates the object, H, with each specified property Name set to the specified Value. You can specify additional name-value pair arguments in any order as (Name1=Value1,...,NameN=ValueN).

example

Properties

expand all

Unless otherwise indicated, properties are nontunable, which means you cannot change their values after calling the object. Objects lock when you call them, and the release function unlocks them.

If a property is tunable, you can change its value at any time.

For more information on changing property values, see System Design in MATLAB Using System Objects.

Set of elements used in the sensor array, specified as a row MATLAB® cell array. Elements specified in the ElementSet property must be either Phased Array System Toolbox™ antennas, microphones, or transducers System objects or Antenna Toolbox™ System object. In addition, all specified antenna elements must have the same polarization capability.

Data Types: double

The mapping of elements in the array, specified as an M-by-N matrix. The property assigns elements to their locations in the array using the indices into the ElementSet property. In this matrix, M represents the number of rows and N represents the number of columns. Rows are along y-axis and columns are along z-axis of the local coordinate system. The values in the matrix specified by ElementIndices should be less than or equal to the number of entries in the ElementSet property.

Data Types: double

The element spacing of the array, specified as a 1-by-2 vector or a scalar (in meters). If ElementSpacing is a 1-by-2 vector, it is in the form of [SpacingBetweenRows,SpacingBetweenColumns]. See Spacing Between Columns and Spacing Between Rows. If ElementSpacing is a scalar, both spacings are the same.

Data Types: double

The element lattice, specified as "Rectangular" or "Triangular". When you set the Lattice property to "Rectangular", all elements in the heterogeneous URA are aligned in both row and column directions. When you set the Lattice property to "Triangular", the elements in even rows are shifted toward the positive row axis direction by a distance of half the element spacing along the row.

Data Types: string

Array normal direction, specified as one of "x", "y", or "z". URA elements lie in a plane orthogonal to the selected array normal direction. Element boresight directions point along the array normal direction.

ArrayNormal Property ValueElement Positions and Boresight Directions
"x"Array elements lie on the yz-plane. All element boresight vectors point along the x-axis. This is the default value.
"y"Array elements lie on the zx-plane. All element boresight vectors point along the y-axis.
"z"Array elements lie on the xy-plane. All element boresight vectors point along the z-axis.

Element tapers, specified as a complex-valued scalar, or a complex-valued 1-by-MN row vector, MN-by-1 column vector, or M-by-N matrix. Tapers are applied to each element in the sensor array. Tapers are often referred to as element weights. M is the number of elements along the z-axis, and N is the number of elements along y-axis. M and N correspond to the values of [NumberofRows, NumberOfColumns] in the Size property. If Taper is a scalar, the same taper value is applied to all elements. If the value of Taper is a vector or matrix, taper values are applied to the corresponding elements. Tapers are used to modify both the amplitude and phase of the received data.

Data Types: double

Usage

Description

RESP = array(FREQ,ANG) returns the array elements’ responses RESP at operating frequencies specified in FREQ and directions specified in ANG.

Input Arguments

expand all

Operating frequencies of array, specified as a length-L row vector. Values are within the frequency range of an array element, specified by either the FrequencyRange or FrequencyVector property, depending on the type of element in the array. The element has zero response at frequencies outside that range. Units are in Hz.

Data Types: double

Response direction, specified as. a real-valued 2-by-M matrix or a real-valued row vector of length M. Units are in degrees,

If ANG is a 2-by-M matrix, each column of the matrix specifies the direction in the form [azimuth;elevation]. The azimuth angle must lie between –180° and 180°, inclusive. The elevation angle must lie between –90° and 90°, inclusive.

If ANG is a row vector of length M, each element specifies the azimuth angle of the direction. In this case, the corresponding elevation angle is assumed to be 0°.

Data Types: double

Output Arguments

expand all

Voltage responses of the phased array. The output depends on whether the array supports polarization or not.

  • If the array is not capable of supporting polarization, the voltage response, RESP, has the dimensions N-by-M-by-L. N is the number of elements in the array. The dimension M is the number of angles specified in ANG. L is the number of frequencies specified in FREQ. For any element, the columns of RESP contain the responses of the array elements for the corresponding direction specified in ANG. Each of the L pages of RESP contains the responses of the array elements for the corresponding frequency specified in FREQ.

  • If the array is capable of supporting polarization, the voltage response, RESP, is a MATLAB struct containing two fields, RESP.H and RESP.V. The field, RESP.H, represents the array’s horizontal polarization response, while RESP.V represents the array’s vertical polarization response. Each field has the dimensions N-by-M-by-L. N is the number of elements in the array, and M is the number of angles specified in ANG. L is the number of frequencies specified in FREQ. Each column of RESP contains the responses of the array elements for the corresponding direction specified in ANG. Each of the L pages of RESP contains the responses of the array elements for the corresponding frequency specified in FREQ.

Object Functions

To use an object function, specify the System object as the first input argument. For example, to release system resources of a System object named obj, use this syntax:

release(obj)

expand all

beamwidthCompute and display beamwidth of an array
collectPlaneWaveSimulate received plane waves
directivityDirectivity of heterogeneous uniform rectangular array
getElementNormalNormal vector to array elements
getElementPositionPositions of array elements
getNumElementsNumber of elements in array
getTaperArray element tapers
isPolarizationCapablePolarization capability
patternAzimuthPlot heterogeneous URA directivity or pattern versus azimuth
patternPlot heterogeneous URA directivity and power pattern
patternElevationPlot heterogeneous ULA directivity or pattern versus elevation
perturbationsPerturbations defined on array
perturbedArrayApply perturbations to phased array
perturbedPatternDisplay pattern of perturbed array
plotResponsePlot response pattern of array
viewArrayView array geometry
stepRun System object algorithm
releaseRelease resources and allow changes to System object property values and input characteristics
resetReset internal states of System object

Examples

collapse all

Construct a 3-by-2 heterogeneous URA with a rectangular lattice, and find the response of each element at 30 degrees azimuth and 0 degrees elevation. Assume the operating frequency is 1 GHz.

antenna1 = phased.CosineAntennaElement(CosinePower=1.5);
antenna2 = phased.CosineAntennaElement(CosinePower=1.8);
array = phased.HeterogeneousURA(ElementSet={antenna1,antenna2}, ...
    ElementIndices=[1 1; 2 2; 1 1]);
fc = 1e9;
ang = [30;0];
resp = array(fc,ang)
resp = 6×1

    0.8059
    0.7719
    0.8059
    0.8059
    0.7719
    0.8059

Plot the azimuth pattern of the array.

c = physconst("LightSpeed");
pattern(array,fc,[-180:180],0,PropagationSpeed=c, ...
    CoordinateSystem="polar",Type="powerdb",Normalize=true)

Figure contains an axes object. The hidden axes object contains 3 objects of type line, text. This object represents 1 GHz .

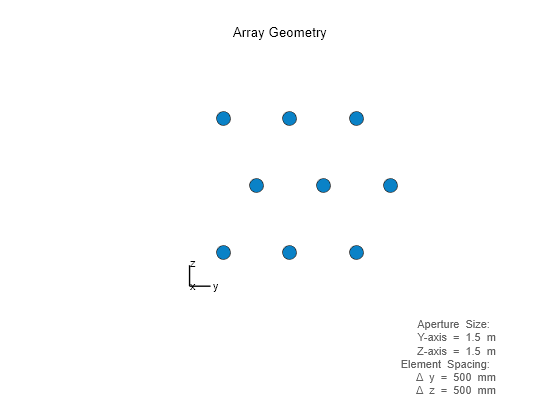
Construct a 3-by-3 heterogeneous URA with a triangular lattice. The element spacing is 0.5 meter. Display the array shape.

elem1 = phased.CosineAntennaElement(CosinePower=1.5);
elem2= phased.CosineAntennaElement(CosinePower=1.8);
array = phased.HeterogeneousURA( ...
    ElementSet={elem1,elem2}, ...
    ElementIndices=[1 1 1; 2 2 2; 1 1 1], ...
    Lattice="Triangular");
viewArray(array)

Figure contains an axes object. The hidden axes object with xlabel x axis (Az 0 El 0) -->, ylabel y axis --> contains 7 objects of type scatter, line, text.

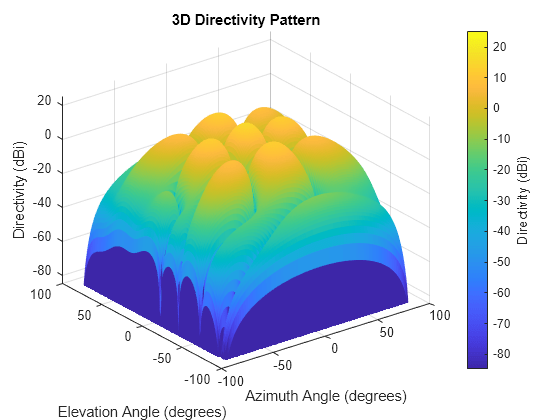
Construct a 2-by-2 rectangular lattice heterogeneous URA of cosine antenna elements. Find the response of each element at 30 degrees azimuth and 0 degrees elevation. Assume the operating frequency is 1 GHz. Then, plot the array directivity.

elem1 = phased.CosineAntennaElement(CosinePower=1.5);
elem2= phased.CosineAntennaElement(CosinePower=1.8);
array = phased.HeterogeneousURA( ...
    ElementSet={elem1,elem2}, ...
    ElementIndices=[1 2; 2 1]);
fc = 1e9;
c = physconst("LightSpeed");
ang = [30;0];
resp = array(fc,ang)
resp = 4×1

    0.8059
    0.7719
    0.7719
    0.8059

Show the 3-D directivity pattern.

pattern(array,fc,-180:180,-90:90, ...
    PropagationSpeed=c, ...
    CoordinateSystem="rectangular", ...
    Type="directivity")

Figure contains an axes object. The axes object with title 3D Directivity Pattern, xlabel Azimuth Angle (degrees), ylabel Elevation Angle (degrees) contains an object of type surface.

More About

expand all

References

[1] Brookner, E., ed. Radar Technology. Lexington, MA: LexBook, 1996.

[2] Brookner, E., ed. Practical Phased Array Antenna Systems. Boston: Artech House, 1991.

[3] Mailloux, R. J. “Phased Array Theory and Technology,” Proceedings of the IEEE, Vol., 70, Number 3, 1982, pp. 246–291.

[4] Mott, H. Antennas for Radar and Communications, A Polarimetric Approach. New York: John Wiley & Sons, 1992.

[5] Van Trees, H. Optimum Array Processing. New York: Wiley-Interscience, 2002.

Extended Capabilities

expand all

Version History

Introduced in R2013a