id1,id2 — Cursor or peak marker identifiers character vector
Cursor or peak marker identifiers, specified as character vector.
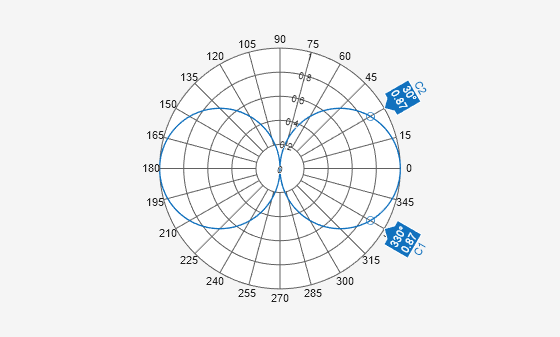
Adding cursors to the polar plot creates cursor marker identifiers.
Adding peaks to the polar plot creates peak marker identifiers.
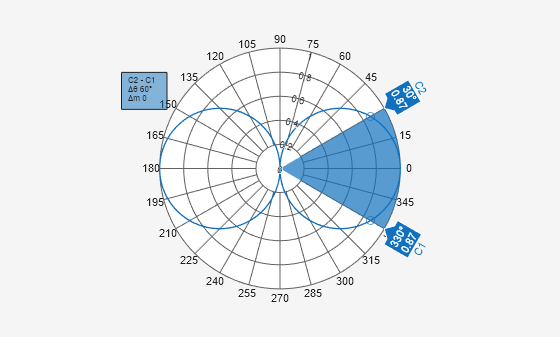
Example: showspan(p,'C1','C2'). Displays the
angle span between cursors, C1 and C2 in
polar plot, p.
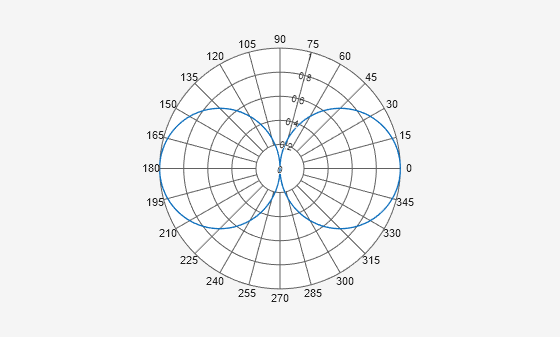
Create a short-dipole antenna element and plot the field values at 250 MHz.
antenna = phased.ShortDipoleAntennaElement('FrequencyRange',[100,900]*1e6,...'AxisDirection','Y');
angs = [-180:1:180];
fc = 250.0e6;
p = pattern(antenna,250.0e6,angs,0,'CoordinateSystem','polar','Type',...'efield','Polarization','H');
P = polarpattern(angs,abs(p));
You can also select a web site from the following list:
How to Get Best Site Performance
Select the China site (in Chinese or English) for best site performance. Other MathWorks country sites are not optimized for visits from your location.