rfplot
Plot cumulative RF budget result vs. cascade input frequency and amplifier power characteristics
Description
Use the rfplot function to plot:
Cumulative RF budget result vs. cascade input frequency
Magnitude response of the S-parameters
Amplifier power characteristics (since R2023a)
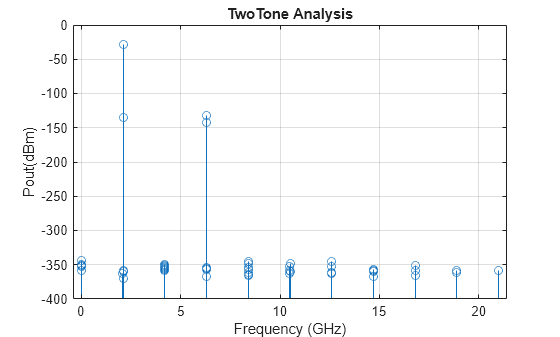
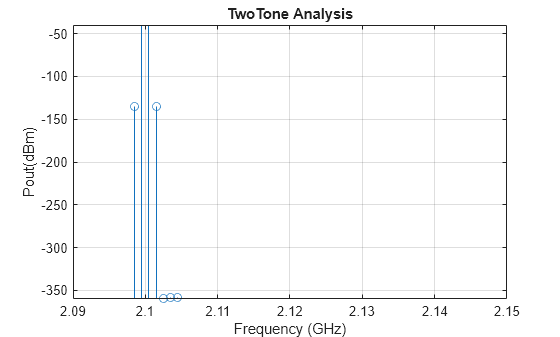
One-tone and two-tone analysis (since R2023b)
rfplot( plots the magnitude
response of rfobj)S-Parameters, S21 for the
cascaded budget object, rfobj.
rfplot(
plots the RF budget result specified by RF parameters rfobj,rfpara)rfpara
versus a range of input frequencies. The input frequencies are applied to the
cascade of elements in the RF budget object, rfobj.
Cumulative (that is, terminated subcascade) results are automatically computed to show the variation of the RF budget result through the entire design.
rfplot( plots the magnitude
response of rfobj,m,n)S-Parameters, Smn
(S11, S12,
S21 , or S22) for the cascaded
budget object, rfobj.
rfplot( plots the
cumulative RF budget result or amplifier power
characteristics (since R2023a) on the axes specified in ax,___)ax
instead of the current axes. Specify ax as the first input
argument followed by any of the input arguments in the previous syntaxes. Return
the current axes using the gca function.
Examples
Input Arguments
Version History
Introduced in R2017bSee Also
rfbudget | show | computeBudget | exportScript | exportRFBlockset | exportTestbench | rfplot | smithplot | polar


