Main Content

getdata

Get simulation data from SimData object

Description

example

[t,x,names] = getdata(simdata) returns the simulation time points t, the simulation data x, and corresponding names for the data columns.

sdOut = getdata(simdata) returns the simulation results as a SimData object sdOut.

example

___ = getdata(simdata,format) returns the simulation data in the specified format.

Examples

collapse all

Load the G-protein model.

sbioloadproject('gprotein.sbproj');

Simulate the model.

sdObj = sbiosimulate(m1);
sbioplot(sdObj);

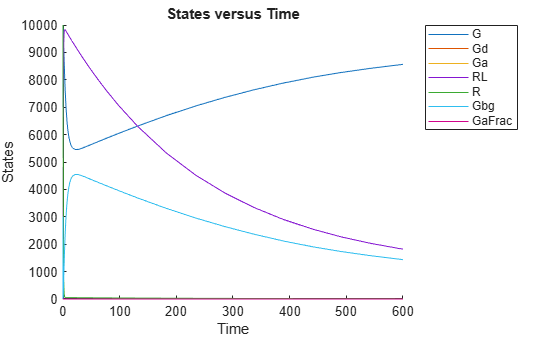
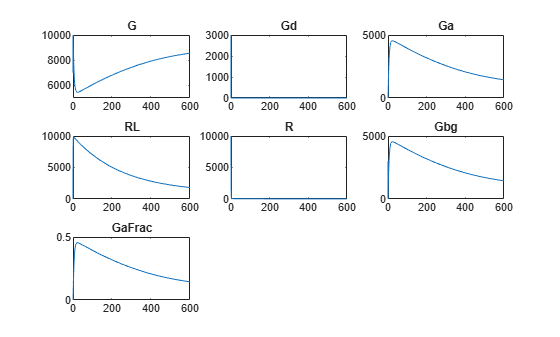
The plot shows all the states together. Plot each state separately on its own axes in a subplot.

First, extract the simulation data from the SimData object.

[time,data,names] = getdata(sdObj);

Calculate the number of rows and columns needed for the subplot.

sqrtnames = sqrt(numel(names));
nrows = round(sqrtnames);
ncolumns = ceil(sqrtnames);

Create a subplot and plot each state on its own axes.

figure
for(i = 1:numel(names))
    subplot(nrows,ncolumns,i)
    plot(time,data(:,i));
    title(names(i));
end

Input Arguments

collapse all

Simulation data, specified as a SimData object or array of SimData objects.

Simulation data format, specified as a character vector or string. Some formats require you to specify only one output argument. The valid formats follow.

  • 'num' — This format returns simulation time points and simulation data in numeric arrays and the names of quantities and sensitivities as a cell array. This format is the default when you run getdata with multiple output arguments.

  • 'nummetadata' — This format returns a cell array of metadata structures instead of the names of quantities and sensitivities as the third output argument.

  • 'numqualnames' — This format returns qualified names in the third output argument to resolve ambiguities.

You must specify only one output argument for the following formats.

  • 'simdata' — This format returns data in a new SimData object or an array of SimData objects. This format is the default when you specify a single output argument.

  • 'struct' — This format returns a structure or structure array that contains both data and metadata.

  • 'ts' — This format returns data as a cell array.

    • If simdata is scalar, the cell array is an m-by-1 array, where each element is a timeseries object. m is the number of quantities and sensitivities logged during the simulation.

    • If simdata is not scalar, the cell array is k-by-1, where each element of the cell array is an m-by-1 cell array of timeseries objects. k is the size of simdata, and m is the number of quantities or sensitivities in each SimData object in simdata. In other words, the function returns an individual time series for each state or column and for each SimData object in simdata.

  • 'tslumped' — This format returns the data as a cell array of timeseries objects, combining data from each SimData object into a single time series.

Output Arguments

collapse all

Simulation time points, returned as a numeric vector or cell array. If simdata is scalar, t is an n-by-1 vector, where n is the number of time points. If simdata is an array of objects, t is a k-by-1 cell array, where k is the size of simdata.

Simulation data, returned as a numeric matrix or cell array. If simdata is scalar, x is an n-by-m matrix, where n is the number of time points and m is the number of quantities and sensitivities logged during the simulation. If simdata is an array of objects, x is a k-by-1 cell array, where k is the size of simdata.

Names of quantities and sensitivities logged during the simulation, returned as a cell array. If simdata is scalar, names is an m-by-1 cell array. If simdata is an array of objects, names is a k-by-1 cell array, where k is the size of simdata.

Simulation results, returned as a SimData object.

Version History

Introduced in R2008b

See Also

| |