Simulink.sdi.setBorderOn
Display or hide border on time plots
Description
Simulink.sdi.setBorderOn( displays or
hides the border on time plots in the Simulation Data Inspector according to the logical
input, border)border. The function sets the value of the Show
border setting on the Time Plot section of the
Visualization Settings in the Simulation Data Inspector. The setting
applies to all time plots in the layout. By default, the Simulation Data Inspector shows the
border on time plots.
Examples
You can use the Simulink.sdi.setBorderOn function to show or hide the border on time plots in the Simulation Data Inspector. By default, the Simulation Data Inspector shows the border on time plots.
This example starts by showing how to use the Simulink.sdi.getBorderOn function to determine whether the border is currently displayed. Subsequent sections show the code to hide and show the border. To show the result, the example generates an image using the Simulink.sdi.snapshot function with settings specified by a Simulink.sdi.CustomSnapshot object.
snapSettings = Simulink.sdi.CustomSnapshot;
snapSettings.Width = 300;
snapSettings.Height = 300;
Get Current Border Display Setting
Before modifying the border display setting for time plots, you can save the current setting to a variable in the workspace in case you want to restore the preference later.
border = Simulink.sdi.getBorderOn;
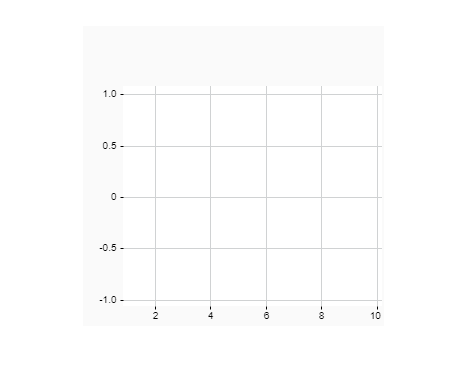
Hide the Border on Time Plots
Simulink.sdi.setBorderOn(false)
Simulink.sdi.snapshot('from','custom','settings',snapSettings);
Show the Border on Time Plots
Simulink.sdi.setBorderOn(true)
Simulink.sdi.snapshot('from','custom','settings',snapSettings);

Input Arguments
Version History
Introduced in R2019b