Simulink Profiler
R2026bAnalyze distribution of compilation and execution time among components and blocks
Description
The Simulink Profiler profiles the distribution of compilation and execution time among components and blocks in a model. To profile the simulation, the Simulink Profiler measures:
Total compile time and the distribution across compilation phases and among model references that simulate in normal mode
The total execution time and the distribution among model references, subsystems, and blocks in the model
Use the profiling results to:
Identify components of the model that create simulation bottlenecks.
Target investigations to improve compile time, execution time, or both.
Prioritize optimization activities.
Focus performance investigations on phases and components that contribute disproportionately to total compilation and execution time. For example, if an S-Function block accounts for most of the execution time, optimizing the S-function code could speed up the simulation.
To simplify and speed up performance analysis, generate AI explanations of profiling results. The AI explanation summarizes key findings and identifies potential bottlenecks in the simulation. To generate AI explanations, you must have a Simulink® Copilot license. (since R2026b)

Open the Simulink Profiler
Simulink Toolstrip: On the Debug tab, in the Performance section, click the Performance button arrow and select Simulink Profiler.

Examples
This example uses a modified version of the model sldemo_fuelsys_dd, which implements a fault-tolerant fuel control system, with a slowdown artificially inserted into the model. Use the Simulink Profiler to identify and resolve the performance issue.
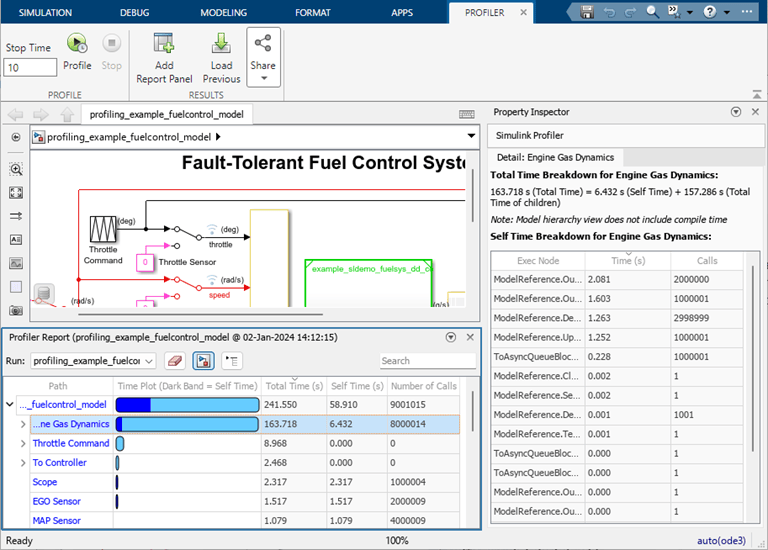
Open the example, which contains the model profiling_example_fuelcontrol_model. To open the Simulink Profiler and analyze the model execution, in the Simulink® Toolstrip, on the Debug tab, click the Performance button arrow and select Simulink Profiler. Opening the Simulink Profiler opens a tab named Profiler in the Simulink Toolstrip, a panel named Profiling Report at the bottom of the Simulink Editor, and the Property Inspector.
To profile the model execution, in the Profiler tab, click Profile. When the profiling simulation completes, the results appear in the Profiler Report pane. By default, the Profiler Report pane displays a table of the profiling results in the block hierarchy view. The structure and hierarchy of the data matches the structure of the model. Each row in the table provides information about the simulation execution time for a block. To view details in the results in the Profiler Report pane, click the arrow (>) next to the row in the table.
The results of the profiling simulation show that the block named Engine Gas Dynamics accounts for a large portion of the total execution time of the top model, which indicates that the block named Engine Gas Dynamics might be a good place to start looking for the source of the performance problem.
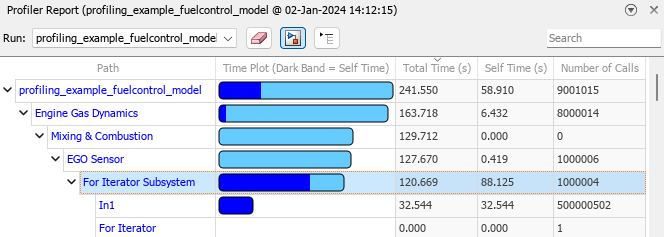
Expand the row for the Engine Gas Dynamics block in the profiling results table to see how the simulation execution time is distributed across blocks inside the subsystem. Continue expanding the row in the profiling results table for the block at each level of hierarchy that accounts for the largest amount of simulation execution time. The subsystem named EGO Sensor contains a for-iterator subsystem that accounts for almost all of the execution time of the subsystem.
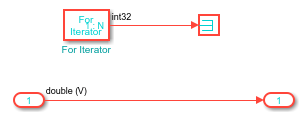
To investigate, navigate inside the for-iterator subsystem. The block diagram inside the subsystem contains only a signal line that connects the subsystem input port to its output port. The for-iterator subsystem serves no functional purpose in the model despite accounting for so much execution time.
To confirm that deleting the for-iterator subsystem block improves simulation time, navigate up the model hierarchy to the subsystem named EGO Sensor. Delete the for-iterator subsystem block, and connect the output of the MATLAB Function block named EGO Sensor to the output port.
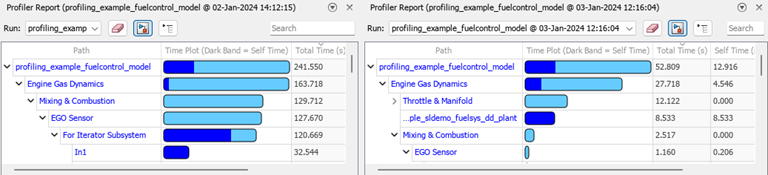
To confirm that removing the for-iterator subsystem improved the performance, profile the modified model. In the Profiler tab, click Profile. To compare the results between the two profiling simulations, click Add Report Panel. By default, the new pane displays the most recent run. To view results from the previous run, from the Run list in the new pane, select the previous profiling simulation run.
You can share the results of the selected profiling simulation run as an HTML report or as a MAT file. To share the profiler report as an HTML report, from the Share menu, select Generate Report. To share the results as a MAT file, from the Share menu, select Export. The HTML report or MAT file is saved in the current working folder.
Since R2024a
Enable fast restart to speed up iterative profiling workflows. Fast restart compiles the model only once, for the first profiling simulation, and skips compilation for subsequent simulations.
In the model you want to profile, enable fast restart. On the Simulation tab, in the Simulate section, click Fast Restart.
Open the Simulink Profiler. On the Debug tab, in the Performance section, click the Performance button arrow and select Simulink Profiler.
Profile a simulation. On the Profiler tab, click Profile.
The simulation compiles the model because this is the first simulation. Profiling the simulation enables the
Profileparameter, which is not tunable while fast restart is enabled. Profiling remains enabled for all simulations you run while fast restart is enabled.Modify a tunable parameter in the model. Then, profile another simulation. Because the model is already compiled and initialized in fast restart, the simulation does not compile the model.
After each simulation, the model remains initialized in fast restart. Subsequent simulations continue to skip compilation, reducing overall simulation time.
To disable fast restart, in the Simulink Toolstrip, on the Simulation tab, click Fast Restart.
Since R2026b
Simplify and speed up performance analysis by using AI to explain profiling results. To generate the AI explanation:
Open the Simulink Profiler. In the Simulink Toolstrip, on the Debug tab, click the Performance button arrow and select Simulink Profiler.
Profile a simulation. In the Simulink Toolstrip, on the Profiler tab, click Profile.
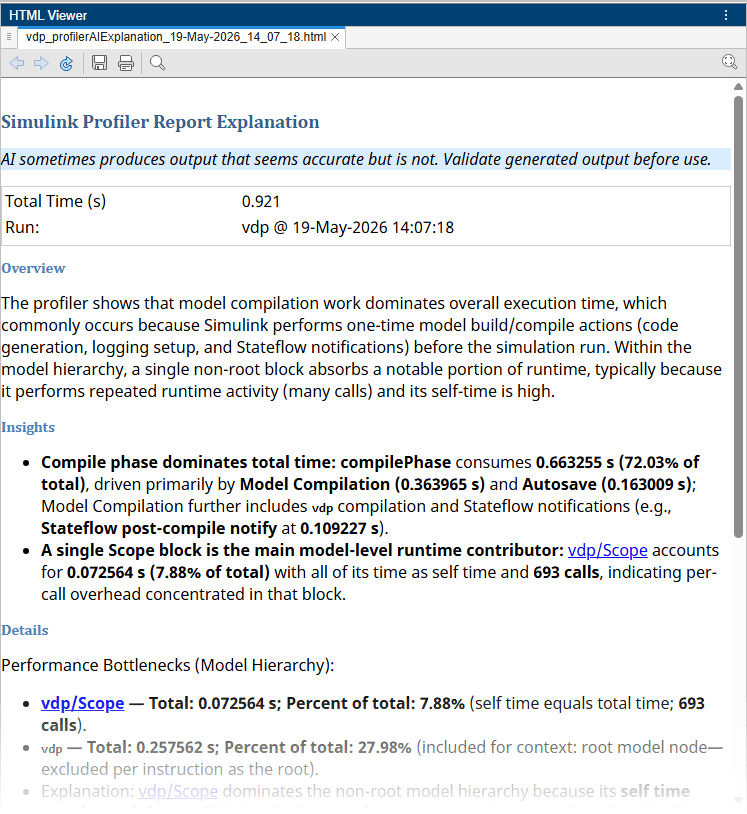
After the profiling simulation completes, generate the AI explanation. On the Profiler tab, click Explain with AI.
The Simulink Profiler generates an HTML file that opens in the MATLAB® HTML Viewer. The explanation provides an overview of the profiling results, highlights specific insights, and summarizes key details from both the model hierarchy and execution views.
Tips
When you want to analyze and improve simulation performance, consider starting the analysis by analyzing your model and simulation configuration using the Performance Advisor.
After analyzing the model and simulation configuration using the Performance Advisor, you can perform deeper analysis by profiling simulations using the Solver Profiler and the Simulink Profiler.
The Solver Profiler analyzes the performance of the selected solver for the model, which can be particularly helpful for simulations that use variable-step solvers. The profiling results help you identify when and why the step size is limited.
The Simulink Profiler helps you identify bottlenecks for simulation performance by analyzing the distribution of simulation execution time among model components.

