Stateflow.Clipboard
Clipboard to copy and paste Stateflow objects
Description
Use the Stateflow.Clipboard object to copy and paste graphical
and nongraphical objects within the same chart, between charts in the same Simulink® model, or between charts in different models.
Creation
There is only one Stateflow.Clipboard object, which is created
automatically when you start Stateflow®. To access this object, call the sfclipboard
function:
clipboard = sfclipboard;
Object Functions
Examples
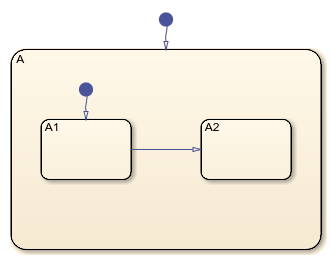
Group a state and copy its contents to the chart. When you group a state, box, or graphical function, you can copy and paste all the objects contained in the grouped object, as well as all the relationships among these objects. This method is the simplest way of copying and pasting objects programmatically. If a state is not grouped, copying the state does not copy any of its contents.

Open the model and access the Stateflow.Chart object for the chart.
open_system("sfHierarchyAPIExample")
ch = find(sfroot,"-isa","Stateflow.Chart");
Find the Stateflow.State object named A.
sA = find(ch,"-isa","Stateflow.State",Name="A");
Group state A and its contents by setting the IsGrouped property for sA to true. Save the previous setting of this property so you can revert to it later.
prevGrouping = sA.IsGrouped;
sA.IsGrouped = true;
Change the name of the state to Copy_of_A. Save the previous name so you can revert to it later.
prevName = sA.Name;
newName = "Copy_of_"+prevName;
sA.Name = newName;
Access the clipboard object.
cb = sfclipboard;
Copy the grouped state to the clipboard.
copy(cb,sA);
Restore the state properties to their original settings.
sA.IsGrouped = prevGrouping;
sA.Name = prevName;
Paste a copy of the objects from the clipboard to the chart.
pasteTo(cb,ch);
Adjust the state properties of the new state.
sNew = find(ch,"-isa","Stateflow.State",Name=newName);
sNew.Position = sA.Position + [400 0 0 0];
sNew.IsGrouped = prevGrouping;

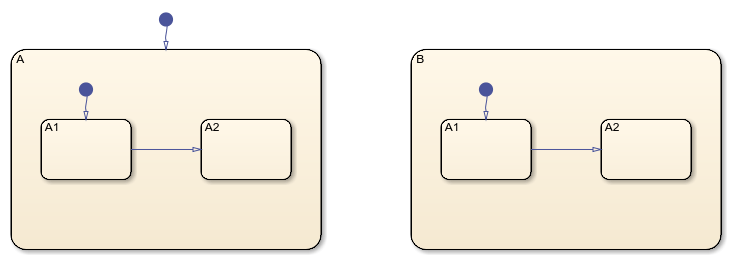
Copy states A1 and A2, along with the transition between them, to a new state in the chart. To preserve transition connections and containment relationships between objects, copy all the connected objects at once.
Open the model and access the Stateflow.Chart object for the chart.
open_system("sfHierarchyAPIExample")
ch = find(sfroot,"-isa","Stateflow.Chart");
Find the Stateflow.State object named A.
sA = find(ch,"-isa","Stateflow.State",Name="A");
Add a new state called B. To enable pasting of other objects inside B, convert the new state to a subchart.
sB = Stateflow.State(ch);
sB.Name = "B";
sB.Position = sA.Position + [400 0 0 0];
sB.IsSubchart = true;
Create an array called objArray that contains the states and transitions in state A. Use the function setdiff to remove state A from the array of objects to copy.
objArrayS = find(sA,"-isa","Stateflow.State");
objArrayS = setdiff(objArrayS,sA);
objArrayT = find(sA,"-isa","Stateflow.Transition");
objArray = [objArrayS objArrayT];
Access the clipboard object.
cb = sfclipboard;
Copy the objects in objArray and paste them in subchart B.
copy(cb,objArray);
pasteTo(cb,sB);
Revert B to a state.
sB.IsSubchart = false;
Assertion failed:  Deviant 'root deviant' not opened for transactions.
Attempt to modify object of type 'StateflowDI.Transition' [id = -1 ]  at kernel/deviant/Deviant.cpp:75: Assertion failed:  Deviant 'root deviant' not opened for transactions.
Attempt to modify object of type 'StateflowDI.Transition' [id = -1 ]  at kernel/deviant/Deviant.cpp:75: Assertion failed:  Deviant 'root deviant' not opened for transactions.
Attempt to modify object of type 'StateflowDI.State' [id = -1 ]  at kernel/deviant/Deviant.cpp:75: Assertion failed:  Deviant 'root deviant' not opened for transactions.
Attempt to modify object of type 'StateflowDI.State' [id = -1 ]  at kernel/deviant/Deviant.cpp:75:
sB.IsGrouped = false;
Reposition the states and transitions in B.
newStates = find(sB,"-isa","Stateflow.State");
newStates = setdiff(newStates,sB);

newTransitions = find(sB,"-isa","Stateflow.Transition");
newOClocks = get(newTransitions,{"SourceOClock","DestinationOClock"});

for i = 1:numel(newStates)
    newStates(i).Position = newStates(i).Position + [25 35 0 0];
end
set(newTransitions,{"SourceOClock","DestinationOClock"},newOClocks);
Version History
Introduced before R2006a