Establecer propiedades de datos
Cuando se crean gráficos de Stateflow® en Simulink®, puede modificar las propiedades de datos en Property Inspector o en Model Explorer.
Para utilizar Property Inspector:
En la pestaña Modeling, en Design Data, seleccione Symbols Pane y Property Inspector.
En el panel Symbols, seleccione el objeto de datos.
En Property Inspector, edite las propiedades de datos.
Para utilizar Model Explorer:
En la pestaña Modeling, en Design Data, seleccione Model Explorer.
En el panel Model Hierarchy, seleccione el elemento principal del objeto de datos.
En el panel Contents, seleccione el objeto de datos.
En el panel Dialog, edite las propiedades de datos.
También puede modificar estas propiedades de forma programática con objetos Stateflow.Data. Para obtener más información sobre la interfaz programática de Stateflow, consulte Visión general de la API de Stateflow.
Las propiedades varían según el ámbito y el tipo del objeto de datos. Para muchas propiedades de datos, puede introducir expresiones o valores de parámetros. Si emplea parámetros para establecer las propiedades para muchos objetos de datos, se simplifica el mantenimiento del modelo, ya que puede actualizar varias propiedades cambiando un único parámetro.
Propiedades de datos de Stateflow
Puede establecer las siguientes propiedades de datos en:
La pestaña Properties de Property Inspector.
La pestaña General de Model Explorer.
Nombre
Nombre del objeto de datos. Para obtener más información, consulte Directrices para nombrar objetos de Stateflow.
Ámbito
Ubicación de los datos en la memoria, en relación con su elemento principal.
| Parámetro | Descripción |
|---|---|
Local | Solo los datos definidos en el gráfico actual. |
Constant | Valor constante de solo lectura que es visible para el objeto de Stateflow principal y sus secundarios. |
Parameter | Constante cuyo valor se define en el área de trabajo base de MATLAB® o se deriva de un parámetro de bloque de Simulink que se define e inicializa en el subsistema enmascarado principal. El objeto de datos de Stateflow debe tener el mismo nombre que la variable de MATLAB, que la entrada del diccionario de datos de Simulink o que el parámetro de Simulink. Para obtener más información, consulte Compartir parámetros con Simulink y el área de trabajo de MATLAB. |
Input | Argumento de entrada para una función si el elemento principal es una función gráfica, una tabla de verdad o una función de MATLAB. De lo contrario, el modelo de Simulink proporciona los datos al gráfico a través de un puerto de entrada en el bloque de Stateflow. Para obtener más información, consulte Compartir datos de entrada y de salida con Simulink. |
Output | Valor devuelto de una función si el elemento principal es una función gráfica, una tabla de verdad o una función de MATLAB. De lo contrario, el gráfico proporciona los datos del modelo de Simulink a través de un puerto de salida en el bloque de Stateflow. Para obtener más información, consulte Compartir datos de entrada y de salida con Simulink. |
Data Store Memory | Objeto de datos que se vincula a un almacén de datos de Simulink, que es una señal que funciona como una variable global. Todos los bloques de un modelo pueden acceder a esa señal. Esta vinculación permite al gráfico leer y escribir en el almacén de datos de Simulink, compartiendo los datos globales con el modelo. El objeto de Stateflow debe tener el mismo nombre que el almacén de datos de Simulink. Para obtener más información, consulte Access Data Store Memory from a Chart. |
Temporary | Datos que persisten solo durante la ejecución de una función. Puede definir datos temporales solo para funciones gráficas, tablas de verdad o funciones de MATLAB en gráficos que usan C como lenguaje de acción. |
Puerto
Índice del puerto asociado al objeto de datos. Esta propiedad se aplica solo a los datos de entrada y de salida. Consulte Compartir datos de entrada y de salida con Simulink.
Método de actualización
Especifica si una variable se actualiza en tiempo discreto o continuo. Esta propiedad solo se aplica cuando el gráfico está configurado para la simulación en tiempo continuo. Consulte Continuous-Time Modeling in Stateflow.
Los datos deben resolverse en un objeto de señal
Especifica que los datos de salida o locales heredan explícitamente propiedades de los objetos Simulink.Signal que tienen el mismo nombre en el área de trabajo base de MATLAB o en el área de trabajo del modelo de Simulink. Los datos pueden heredar las siguientes propiedades:
Tamaño
Complejidad
Tipo
Unidad
Valor mínimo
Valor máximo
Valor inicial
Clase de almacenamiento
Modo de muestreo (para datos de salida del bloque Truth Table)
Esta opción solo está disponible cuando se establece el parámetro de configuración Signal resolution en un valor distinto de None. Para obtener más información, consulte Resolver propiedades de datos a partir de objetos de señales de Simulink.
Tamaño
Tamaño del objeto de datos. El tamaño puede ser un valor escalar o un vector de valores de MATLAB.
Para especificar un escalar, establezca la propiedad Size en
1o deje el campo vacío.Para especificar un vector columna de
npor 1, establezca la propiedad Size enn.Para especificar un vector fila de 1 por
n, establezca la propiedad Size en[1.n]Para especificar una matriz de
nporm, establezca la propiedad Size en[.nm]Para especificar un arreglo de
ndimensiones, establezca la propiedad Size en[, donded1d2⋯dn]dies el tamaño de lai-ésima dimensión.Para configurar que un objeto de datos de Stateflow herede el tamaño de la señal de Simulink correspondiente o de su definición en el gráfico, especifique un tamaño de
–1.
El ámbito del objeto de datos determina qué tamaños puede especificar. La memoria del almacén de datos de Stateflow hereda todas sus propiedades, incluido el tamaño, del almacén de datos de Simulink al que está vinculada. Para el resto de ámbitos, el tamaño puede ser un escalar, un vector o una matriz de n dimensiones. Para obtener más información, consulte Especificar el tamaño de los datos de Stateflow.
Puede especificar el tamaño de los datos mediante una expresión de MATLAB que se evalúe como una especificación de tamaño válida. Para obtener más información, consulte Especificar el tamaño de los datos utilizando expresiones y Especificar las propiedades de los datos utilizando expresiones de MATLAB.
Tamaño variable
Especifica que el objeto de datos cambia de tamaño durante la simulación. Esta opción solo está disponible cuando se habilita la propiedad de gráfico Support variable-size arrays. Para obtener más información, consulte Declare Variable-Size Data in Stateflow Charts.
Complejidad
Especifica si el objeto de datos acepta valores complejos.
| Parámetro | Descripción |
|---|---|
Off | El objeto de datos no acepta valores complejos. |
On | El objeto de datos acepta valores complejos. |
Inherited | El objeto de datos hereda el ajuste de complejidad de un bloque de Simulink. |
El valor predeterminado es Off. Para obtener más información, consulte Complex Data in Stateflow Charts.
Primer índice
Índice del primer elemento del arreglo de datos. El primer índice puede ser cualquier entero. El valor predeterminado es 0. Esta propiedad solo está disponible para gráficos C.
Tipo
Tipo de objeto de datos. Para especificar el tipo de datos:
En la lista desplegable Type, seleccione un tipo integrado.
En el campo Type, introduzca una expresión que se evalúe como un tipo de datos. Utilice una de estas expresiones:
Una llamada a la función
fixdt(Simulink) para crear un objetoSimulink.NumericType(Simulink) que describa un tipo de datos de punto fijo o de punto flotante. Consulte Specify Fixed-Point Data.Una llamada al operador
typepara especificar el tipo de los datos previamente definidos. Consulte Derivar tipos de datos de otros objetos de datos.Un objeto
Simulink.AliasType(Simulink) que define un alias de tipo de datos en el área de trabajo base de MATLAB. Consulte Especificar los tipos de datos usando un alias de Simulink.
Para obtener más información, consulte Especificar las propiedades de los datos utilizando expresiones de MATLAB.
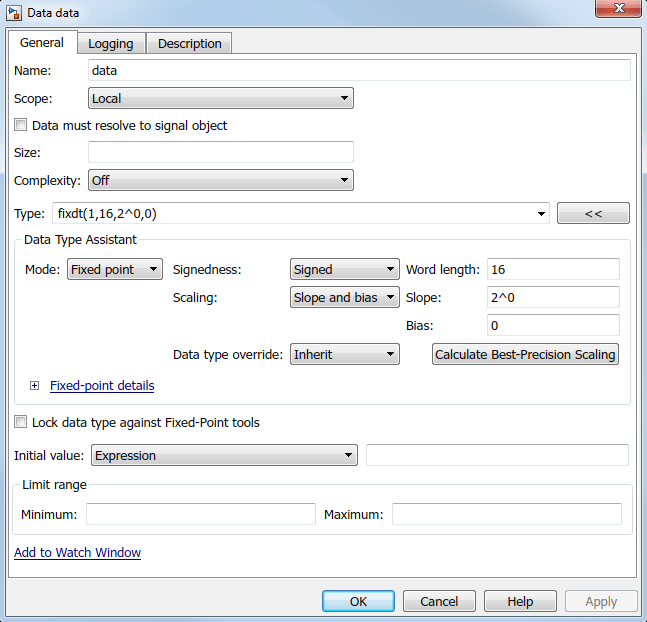
Además, en Model Explorer, puede abrir el asistente de tipo de datos haciendo clic en el botón Show data type assistant  . Especifique un dato Mode y, luego, especifique el tipo de datos en función de ese modo. Para obtener más información, consulte Especificar el ámbito y el tipo de datos de Stateflow.
Nota
Si introduce una expresión para un tipo de datos de punto fijo, deberá especificar el escalado explícitamente. Por ejemplo, no puede introducir una especificación incompleta como fixdt(1,16) en el campo Type. Si no especifica el escalado explícitamente, aparecerá un error cuando intente simular el modelo.
Bloquear tipo de datos frente a herramientas de punto fijo
Evita el reemplazo del tipo de punto fijo actual por un tipo autoescalado que ha elegido Fixed-Point Tool (Fixed-Point Designer). Para obtener más información, consulte Iterative Fixed-Point Conversion Using the Fixed-Point Tool (Fixed-Point Designer).
Unidad (p. ej., m, m/s^2, N*m)
Especifica unidades físicas para datos de entrada y salida. Para obtener más información, consulte Specify Units for Stateflow Data.
Valor inicial
Valor inicial del objeto de datos. Para los datos constantes, esta propiedad se denomina Constant value. Las opciones para especificar esta propiedad dependen del ámbito del objeto de datos.
| Ámbito | Especificar para el valor inicial |
|---|---|
Local | Expresión o parámetro definido en la jerarquía de Stateflow, área de trabajo base de MATLAB o subsistema enmascarado de Simulink. Especifique si Initial value es una expresión o parámetro utilizando la propiedad de datos Inicializar un método. |
Constant | Valor constante o expresión. La expresión se evalúa cuando se actualiza el gráfico. El valor resultante se utiliza como una constante para ejecutar el gráfico. Cuando deje en el campo Constant value vacío, los datos numéricos se resuelven en un valor predeterminado de 0. Para los datos enumerados, el valor predeterminado suele ser el primero que aparece en la sección |
Parameter | No puede introducir un valor. El gráfico hereda el valor inicial desde el parámetro. |
Input | No puede introducir un valor. El gráfico hereda el valor inicial desde la señal de entrada de Simulink en el puerto designado. |
Output | Expresión o parámetro definido en la jerarquía de Stateflow, área de trabajo base de MATLAB o subsistema enmascarado de Simulink. Especifique si Initial value es una expresión o parámetro utilizando la propiedad de datos Inicializar un método. |
Data Store Memory | No puede introducir un valor. El gráfico hereda el valor inicial desde el almacén de datos de Simulink al que resuelve. |
El tiempo de inicialización depende del elemento principal de los datos y del ámbito del objeto de datos de Stateflow.
Elemento principal de los datos | Ámbito | Tiempo de inicialización |
|---|---|---|
Gráfico | Entrada | No se aplica |
Salida, local | Inicio de la simulación o cuando el gráfico se reinicializa como parte de un subsistema de Simulink activado | |
Estado con intersección histórica | Local | Inicio de la simulación o cuando el gráfico se reinicializa como parte de un subsistema de Simulink activado |
Estado sin intersección histórica | Local | Acceso al estado |
Función (gráfica, de tablas de verdad y funciones de MATLAB) | Entrada, salida | Invocación de llamada a función |
Local | Inicio de la simulación o cuando el gráfico se reinicializa como parte de un subsistema de Simulink activado |
Para obtener más información sobre el uso de una expresión para especificar un valor inicial, consulte Especificar las propiedades de los datos utilizando expresiones de MATLAB.
Inicializar un método
Especifica el método de inicialización para objetos de datos locales y de salida.
Expression: asigna una expresión como valor inicial del objeto de datos.Cuando no se especifica la propiedad Initial value, los datos numéricos se inicializan en un valor predeterminado de 0. Para los datos enumerados, el valor predeterminado suele ser el primero que aparece en la sección
enumerationde la definición. Puede especificar un valor enumerado predeterminado diferente en la secciónmethodsde la definición. Para obtener más información, consulte Definir tipos de datos enumerados.Parameter: asignar una variable en el área de trabajo de MATLAB como valor inicial del objeto de datos. Si no se especifica el campo Initial value, Stateflow busca una variable de MATLAB con el mismo nombre que el objeto de datos.
El ajuste predeterminado es Expression.
Nota
Property Inspector no admite inicializar buses cuando establece esta propiedad en Expression. Para obtener más información, consulte Inicializar buses de Stateflow.
Rango límite
Rango de valores aceptables para este objeto de datos. Los gráficos de Stateflow utilizan este rango para validar el objeto de datos durante la simulación.
Minimum: el valor más pequeño permitido para el elemento de datos durante la simulación. Puede introducir una expresión o un parámetro que se evalúe en un valor escalar numérico.
Maximum: el valor más grande permitido para el elemento de datos durante la simulación. Puede introducir una expresión o un parámetro que se evalúe en un valor escalar numérico.
El valor más pequeño que puede establecer para Minimum es -inf. El valor más grande que puede establecer para Maximum es inf.
Puede especificar los valores mínimo y máximo mediante una expresión de MATLAB. Para obtener más información, consulte Especificar las propiedades de los datos utilizando expresiones de MATLAB.
Nota
Un modelo de Simulink utiliza las propiedades Maximum y Minimum para calcular el escalado de máxima precisión para los tipos de datos de punto fijo. Antes de seleccionar Calculate Best-Precision Scaling, especifique el valor mínimo o máximo. Para obtener más información, consulte Calcular el escalado de máxima precisión.
Propiedades de datos de punto fijo
En Model Explorer, cuando establece el asistente de tipo de datos Mode en Fixed point, el asistente de tipo de datos muestra campos para especificar información adicional sobre los datos de punto fijo.
Representación de signo
Especifica si el dato de punto fijo es Signed o Unsigned. Los datos con signo pueden representar valores positivos y negativos. Los datos sin signo solo representan valores positivos. El ajuste predeterminado es Signed.
Longitud de palabra
Especifica el tamaño de bits de la palabra que contiene el entero cuantificado. Los tamaños de palabra grandes representan los valores grandes con mayor precisión que los tamaños de palabra pequeños. El valor predeterminado es 16.
La longitud de palabra puede ser cualquier entero desde 0 hasta 128 para los datos en el nivel de gráfico de los siguientes ámbitos:
InputOutputParameterData Store Memory
Para otros datos de Stateflow, la longitud de palabra puede ser cualquier número entero desde 0 hasta 32.
Puede especificar la longitud de palabra mediante una expresión de MATLAB. Para obtener más información, consulte Especificar las propiedades de los datos utilizando expresiones de MATLAB.
Escalado
Especifica el método para escalar datos de punto fijo para evitar condiciones de desbordamiento y disminuir los errores de cuantificación. El método predeterminado es escalado Binary point.
| Parámetro | Descripción |
|---|---|
Binary point | Si selecciona este modo, el asistente de tipo de datos muestra el campo Fraction length, que especifica la ubicación del punto binario. Fraction length puede ser cualquier entero. El valor predeterminado es 0. Un entero positivo desplaza el punto binario a la izquierda del bit situado más a la derecha por esa cantidad. Un entero negativo desplaza el punto binario más a la derecha del bit situado más a la derecha.
|
Slope and bias | Si selecciona este modo, el asistente de tipo de datos muestra campos para introducir Slope y Bias para el esquema de cifrado de punto fijo. Slope puede ser cualquier número real positivo. El valor predeterminado es 1.0. Bias puede ser cualquier número real. El valor predeterminado es 0.0. Puede introducir la pendiente y el sesgo como expresiones que contengan parámetros que defina en el área de trabajo base de MATLAB. |
Siempre que sea posible, utilice el escalado de punto binario para simplificar la implementación de los datos de punto fijo en el código generado. Las operaciones con datos de punto fijo que utilizan el escalado de punto binario se realizan con simples desplazamientos de bits y eliminan las costosas implementaciones de código que se requieren para separar los valores de pendiente y sesgo. Para obtener más información sobre el escalado de punto fijo, consulte Scaling, Range, and Precision (Fixed-Point Designer).
Puede especificar Fraction length, Slope y Bias mediante una expresión de MATLAB. Para obtener más información, consulte Especificar las propiedades de los datos utilizando expresiones de MATLAB.
Anulación del tipo de datos
Especifica si se hereda la configuración de anulación del tipo de datos de la herramienta Fixed-Point que se aplica a este modelo. Si los datos no heredan la configuración de todo el modelo, se aplica el tipo de datos especificado.
Calcular el escalado de máxima precisión
Especifica si calcular los valores de máxima precisión para el escalado Binary point y Slope and bias en función de los valores en las propiedades Minimum y Maximum.
Para calcular los valores de escalado de máxima precisión:
Especifique las propiedades Maximum y Minimum.
Haga clic en Calculate Best-Precision Scaling.
Los valores de escalado de máxima precisión se muestran en el campo Fraction length o en los campos Slope y Bias. Para obtener más información, consulte Maximize Precision (Fixed-Point Designer).
Nota
Las propiedades Maximum y Minimum no se aplican a los ámbitos Constant y Parameter. Para Constant, el software de Simulink calcula los valores de escalado en función de la configuración de Initial value. El software no puede calcular el escalado de máxima precisión para los datos del ámbito Parameter.
Detalles del punto fijo
Muestra información sobre el tipo de datos de punto fijo que está definido en el asistente de tipo de datos:
MinimumyMaximummuestran los mismos valores que se especifican en las propiedades Minimum y Maximum.Representable minimum,Representable maximumyPrecisionmuestran el valor mínimo, el valor máximo y precisión que el tipo de datos de punto fijo puede representar.
Si no se puede determinar el valor de un campo sin compilar primero el modelo, el subpanel Fixed-point details muestra el valor como Unknown.

Los valores mostrados por el subpanel Fixed-point details no se actualizan automáticamente si cambia los valores que definen el tipo de datos de punto fijo. Para actualizar los valores que se muestran en el subpanel Fixed-point details, haga clic en Refresh Details.
Si se hace clic en Refresh Details, el modelo no se modifica. Solo se cambia la visualización. Para aplicar los valores mostrados, haga clic en Apply o en OK.
El subpanel Fixed-point details indica cualquier error que resulta de la especificación del tipo de datos de punto fijo. Por ejemplo, esta figura muestra dos errores.
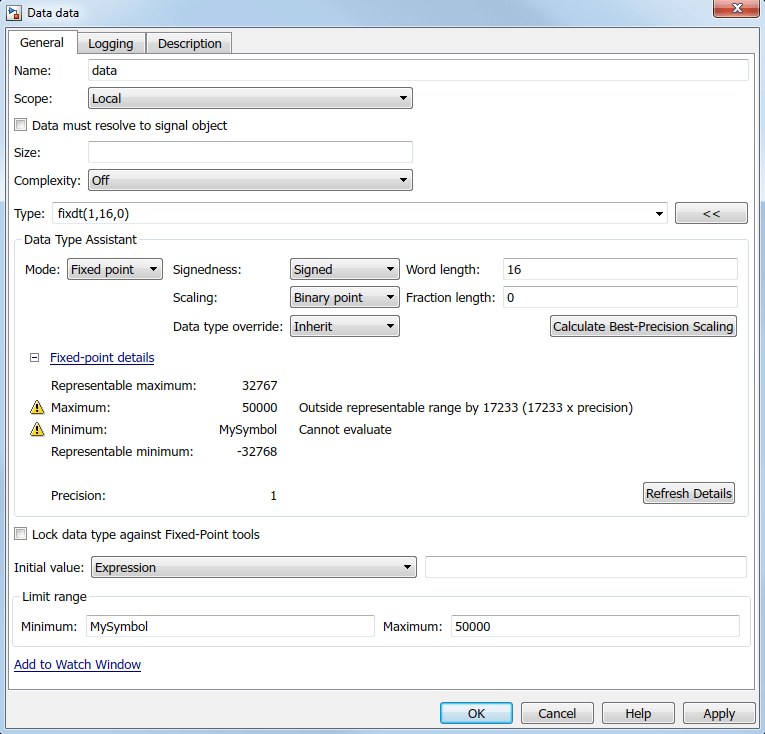
La fila con la etiqueta Maximum indica que el valor especificado por la propiedad Maximum no es representable por el tipo de datos de punto fijo. Para corregir el error, realice una de las siguientes modificaciones para que el tipo de datos de punto fijo pueda representar el valor máximo:
Disminuir el valor en la propiedad Maximum.
Aumentar Word length.
Disminuir Fraction length.
La fila con la etiqueta Minimum muestra el error Cannot evaluate porque evaluar la expresión MySymbol, especificada por la propiedad Minimum no devuelve un valor numérico. Cuando una expresión no se evalúa correctamente, el subpanel Fixed-point details muestra la expresión sin evaluar (truncando a 10 caracteres según sea necesario) en lugar del valor no disponible. Para corregir este error, defina MySymbol en el área de trabajo base para proporcionar un valor numérico. Si hace clic en Refresh Details, se eliminan el indicador de error y la descripción, y aparece el valor de MySymbol en lugar del texto sin evaluar.
Propiedades de registro
Puede establecer las propiedades de registro para los datos en:
La pestaña Properties de Property Inspector.
La pestaña Logging de Model Explorer.
Registrar datos de señales
Indica si se activa el registro de señales. El registro de señales guarda los valores del objeto de datos en el área de trabajo de MATLAB durante la simulación. Para obtener más información, consulte Log Simulation Output for States and Data.
Nombre de registro
Nombre de la señal utilizado para registrar el objeto de datos.
Para usar el nombre del objeto de estado, seleccione
Use signal name(predeterminado).Para especificar un nombre diferente, seleccione
Custome introduzca el nombre de registro personalizado.
Registrar solo los últimos puntos de datos
Indica si se limita el número de puntos de datos que se desea registrar al máximo especificado. Por ejemplo, si se establece el número máximo de puntos de datos en 5000, el gráfico solo agrega en un registro los últimos 5000 puntos de datos generados por la simulación.
Diezmado
Indica si se limita la cantidad de datos registrados omitiendo muestras usando el intervalo de diezmado especificado. Por ejemplo, si se establece un intervalo de diezmado de 2, el gráfico agrega una de cada dos muestras en un registro.
Punto de prueba
Indica si se establece el objeto de datos como un punto de prueba que puede supervisar con un scope flotante durante la simulación. También pueden agregar en un registro los valores de los puntos de prueba en el área de trabajo de MATLAB. Para obtener más información, consulte Configure Signals as Test Points (Simulink).
Propiedades adicionales
Puede establecer propiedades de datos adicionales en:
La pestaña Info de Property Inspector.
La pestaña Description de Model Explorer.
Guardar el valor final en el área de trabajo base
Asigna el valor del objeto de datos a una variable con el mismo nombre en el área de trabajo base de MATLAB al final de la simulación. Esta opción solo está disponible en Model Explorer para los gráficos que utilizan C como lenguaje de acción. Para obtener más información, consulte Model Workspaces (Simulink).
Unidades
Unidades de medida asociadas al objeto de datos. La unidad de este campo reside con el objeto de datos en la jerarquía de Stateflow. Esta propiedad solo está disponible en Model Explorer para gráficos C.
Descripción
Descripción del objeto de datos.
Enlace del documento
Enlace a la documentación online del objeto de datos. Puede introducir una dirección URL o un comando de MATLAB que muestre la documentación como un archivo HTML o como texto en la ventana de comandos de MATLAB. Cuando hace clic en el hipervínculo Document link, Stateflow evalúa el enlace y muestra la documentación.
Valores predeterminados de las propiedades de datos
Cuando deja un campo de propiedad vacío, Stateflow asume un valor predeterminado.
| Propiedad | Valor predeterminado | |
|---|---|---|
| Tamaño |
| |
| Primer índice | 0 | |
| Valor inicial | 0.0 | |
| Rango límite | Minimum | -inf |
| Maximum | inf | |
| Propiedades de datos de punto fijo | Word length | 16 |
| Fraction length | 0 | |
| Slope | 1.0 | |
| Bias | 0.0 | |
Especificar las propiedades de los datos utilizando expresiones de MATLAB
En Property Inspector y Model Explorer, puede introducir expresiones de MATLAB como valores para las siguientes propiedades:
Rango límite: Minimum y Maximum
Propiedades de datos de punto fijo: Word length, Fraction length, Slope y Bias
Las expresiones pueden contener una combinación de valores numéricos, constantes, parámetros, variables, operadores aritméticos y llamadas a funciones de MATLAB. Por ejemplo, puede utilizar estas funciones para especificar las propiedades de los datos.
| Propiedad | Función | Descripción |
|---|---|---|
| Size | size | Devuelve el tamaño de un objeto de datos |
| Type | type | Devuelve el tipo de un objeto de datos |
fixdt (Simulink) | Devuelve un objeto Simulink.NumericType que describe un tipo de datos de punto fijo o de punto flotante | |
fi (Fixed-Point Designer) | Devuelve un objeto numérico de punto fijo | |
| Minimum | min | Devuelve el elemento más pequeño o los elementos de un arreglo |
| Maximum | max | Devuelve el elemento más grande o los elementos de un arreglo |
Para obtener más información, consulte Especificar el tamaño de los datos utilizando expresiones y Derivar tipos de datos de otros objetos de datos.
Consulte también
Objetos
Stateflow.Data|Simulink.AliasType(Simulink) |Simulink.NumericType(Simulink)
Funciones
Herramientas
- Model Explorer (Simulink)