Super Step Semantics
By default, Stateflow® charts execute once for each input event or time step. If you are modeling a system that must react quickly to inputs, you can enable super step semantics.
When you enable super step semantics, a Stateflow chart executes multiple times for every active input event or for every time step when the chart has no input events. The chart takes valid transitions until either of these conditions occurs:
No more valid transitions exist, so the chart is in a stable active state configuration.
The number of transitions taken exceeds a user-specified maximum number of iterations.
For simulation targets, you can specify whether the chart goes to the next time step or generates an error if it reaches the maximum number of iterations prematurely. In generated code for embedded targets, the chart always goes to the next time step after reaching the maximum number of iterations.
Maximum Number of Iterations
In a super step, your chart always takes at least one transition. Therefore, when you set a maximum number of iterations in each super step, the chart takes that number of transitions plus 1. For example, if you specify 10 as the maximum number of iterations, your chart takes 11 transitions in each super step.
Tip
When generating code for an embedded target, make sure that the chart can finish the computation in a single time step. To achieve this behavior, fine-tune your chart by setting the maximum number of iterations that the chart takes per time step.
Enable Super Step Semantics
To enable super step semantics:
Select the Enable super step semantics chart property, as described in Enable super step semantics.
Enter a value for Maximum iterations in each super step.
The chart always takes one transition during a super step, so the value
Nthat you specify represents the maximum number of additional transitions (for a total ofN+1). Try to choose a number that allows the chart to reach a stable state within the time step, based on the mode logic of your chart.Select an action for Behavior after too many iterations.
Your selection determines how the chart behaves during simulation after it reaches the maximum number of iterations in a time step.
Behavior Description ProceedChart execution continues to the next time step. Throw ErrorSimulation stops and an error message appears. This setting is valid only for simulation. In generated code, chart execution always proceeds to the next time step rather than generating an error.
Note
Selecting Throw Error can help detect infinite loops in transition cycles. For more information, see Detection of Infinite Loops in Transition Cycles.
Example of Chart with Super Step Semantics
This example shows how super step semantics differs from default semantics. The model contains two Stateflow charts. One chart uses super step semantics. In the other, super step semantics are disabled.
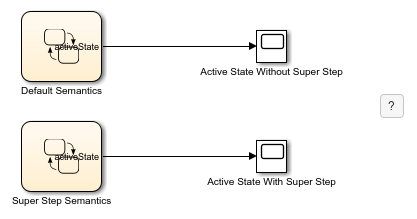
Each chart contains an identical sequence of states connected by transitions.

By default, the chart takes only one transition in each simulation step, progressing through states A, B, and C.

When you enable super step semantics, the chart takes all valid transitions in one step, stopping at state C.

How Super Step Semantics Works with Multiple Input Events
When you enable super step semantics for a chart with multiple active input events,
the chart takes all valid transitions for the first active event before it begins
processing the next active event. For example, in this model, the Sum (Simulink) block produces a 2-by-1 vector signal that goes from [0,0] to [1,1] at
time t = 1.
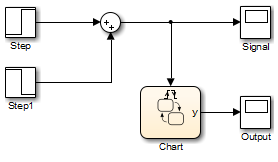
As a result, when the model wakes up the chart, events E1 and
E2 are both active:
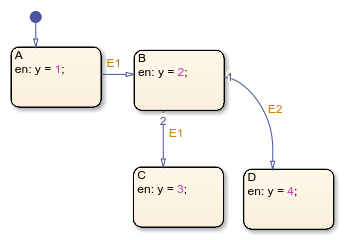
If you enable super step semantics, the chart takes all valid transitions for event
E1. The chart takes transitions from state A to
B and then from state B to C
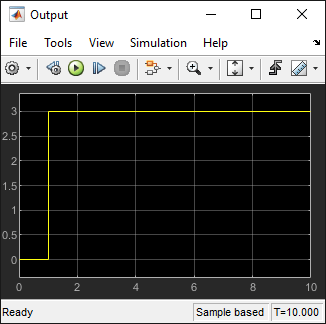
in a single super step. The Scope block shows that y =
3 at the end of the super step.
In a super step, this chart never transitions to state D because
there is no path from state C to state D.
Detection of Infinite Loops in Transition Cycles
If your chart contains transition cycles, taking multiple transitions in a single time step can cause infinite loops. Consider the following example:
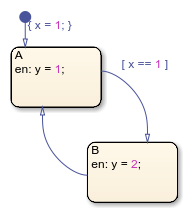
In this example, the transitions between states A and
B cycle and produce an infinite loop because the value of
x remains constant at 1. One way to detect infinite loops is to
configure your chart to generate an error if it reaches a maximum number of iterations
in a super step. See Enable Super Step Semantics.