optimizeResponse
Predictor and response values at response surface maximum or minimum of linear regression model
Since R2026a
Syntax
Description
optVals = optimizeResponse(mdl,"max")mdl. The response surface is bounded by the
minimum and maximum values of each predictor in the model.
Note
This function requires Optimization Toolbox™. Global Optimization Toolbox is also required if mdl has interaction terms with
categorical variables whose values are not fixed using
CategoricalValues.
optVals = optimizeResponse(___,Name=Value)
Examples
Fit a linear regression model and find the response and predictor values at maximum and minimum of the model's response surface.
Load the hald data set. Create a table containing the response variable, which is the heat evolved during hardening of a cement mixture, and the first two predictors, which are the amount of tricalcium aluminate and tricalcium silicate in the mixture.
load hald
X = ingredients(:,1:2);
tbl = array2table([heat X],VariableNames=["heat" "x1" "x2"]);
Fit a linear regression model by using fitlm.
mdl = fitlm(tbl,"heat")mdl =
Linear regression model:
heat ~ 1 + x1 + x2
Estimated Coefficients:
Estimate SE tStat pValue
________ ________ ______ __________
(Intercept) 52.577 2.2862 22.998 5.4566e-10
x1 1.4683 0.1213 12.105 2.6922e-07
x2 0.66225 0.045855 14.442 5.029e-08
Number of observations: 13, Error degrees of freedom: 10
Root Mean Squared Error: 2.41
R-squared: 0.979, Adjusted R-Squared: 0.974
F-statistic vs. constant model: 230, p-value = 4.41e-09
Find the predictor values where the heat value is a maximum, and where the heat value is a minimum.
maxResp = optimizeResponse(mdl,"max")maxResp=1×3 table
x1 x2 heat
__ __ ______
21 71 130.43
minResp = optimizeResponse(mdl,"min")minResp=1×3 table
x1 x2 heat
__ __ ______
1 26 71.264
Visualize the response surface and the maximum and minimum values.
% Create a grid of predictor values
x1_range = linspace(min(X(:,1)),max(X(:,1)),30);
x2_range = linspace(min(X(:,2)),max(X(:,2)),30);
[X1, X2] = meshgrid(x1_range,x2_range);
predict_tbl = table(X1(:),X2(:),VariableNames=["x1" "x2"]);

% Compute the predicted response values
Y_pred = predict(mdl,predict_tbl);
Y_pred_grid = reshape(Y_pred,size(X1));

% Plot the response surface
figure
surf(X1, X2, Y_pred_grid)
xlabel("x1")
ylabel("x2")
zlabel("Predicted Heat")
colorbar
shading interp

% Add the maximum and minimum values to the plot
hold on
plot3(maxResp.x1,maxResp.x2,maxResp.heat,"ro", ...
MarkerSize=5,MarkerFaceColor="r")
text(maxResp.x1,maxResp.x2,maxResp.heat,"  Maximum",Color="r")
plot3(minResp.x1,minResp.x2,minResp.heat,"ro", ...
MarkerSize=5,MarkerFaceColor="b")
text(minResp.x1,minResp.x2,minResp.heat,"  Minimum",Color="b")
hold off
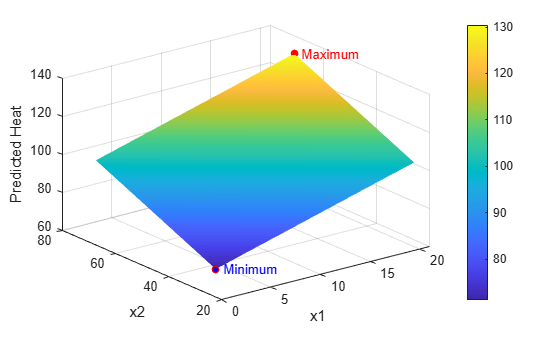
The plot shows that the predicted heat has a maximum value of 130.4 for x1 = 21 and x2 = 72. The predicted heat has a minimum value of 71.3 for x1 = 1 and x2 = 26.
Fit a linear regression model to data that includes categorical predictors, and find the maximum predicted response value and the corresponding predictor values.
Load the patients data set, which contains simulated data for 100 hospital patients.
load patientsConvert the Gender and Smoker predictors to categorical.
Gender = categorical(Gender);
Smoker = categorical(Smoker);
Create a table containing the Age, Gender, Smoker, Weight, and Diastolic predictors.
tbl = table(Age,Gender,Smoker,Weight,Diastolic);
Fit a linear regression model to the Diastolic predictor using fitlm. Specify a model that includes linear terms for Age and Weight, and an interaction term involving Gender and Smoker.
mdl = fitlm(tbl,"Diastolic ~ Age + Weight + Gender*Smoker");Find the maximum predicted response value over the Weight value range [100 200], subject to the additional constraints that the patient is a 40-year-old nonsmoker. In this example, Global Optimization Toolbox is required because the Gender predictor is categorical and its value is not fixed. If you have Global Optimization Toolbox, you can uncomment the lines below.
% maxResp = optimizeResponse(mdl,"max",LowerBounds=[40,100], ...
%    UpperBounds=[40,200],CategoricalValues={[] categorical(false)})
If you do not have Global Optimization toolbox, you can perform separate searches for a set of predictor values when Gender=Male and Gender=Female.
maxRespMale = optimizeResponse(mdl,"max",LowerBounds=[40,100], ...
UpperBounds=[40,200],CategoricalValues={"Male" categorical(false)})
maxRespMale=1×5 table
    Age    Gender    Smoker    Weight    Diastolic
    ___    ______    ______    ______    _________

    40      Male     false      200        80.22
maxRespFemale = optimizeResponse(mdl,"max",LowerBounds=[40,100], ...
UpperBounds=[40,200],CategoricalValues={"Female" categorical(false)})
maxRespFemale=1×5 table
    Age    Gender    Smoker    Weight    Diastolic
    ___    ______    ______    ______    _________

    40     Female    false      200       80.172
The maximum predicted response in the specified weight range is 80.22 for a 40-year-old nonsmoker male.
Input Arguments
Name-Value Arguments
Output Arguments
Version History
Introduced in R2026a