Contenido principal

mvtcdf

Multivariate t cumulative distribution function

Description

p = mvtcdf(X,C,nu) returns the cumulative distribution function (cdf) of the multivariate t distribution with the correlation parameters C and degrees of freedom nu, evaluated at each row of X.

example

p = mvtcdf(xl,xu,C,nu) returns the multivariate cdf evaluated over the multidimensional rectangle with lower and upper limits defined by xl and xu, respectively.

p = mvtcdf(___,options) specifies control parameter options for the numerical integration used to compute p, using any of the input argument combinations in the previous syntaxes. Create the options argument using the statset function.

[p,err] = mvtcdf(___) additionally returns an estimate of the error in p. For more information, see Algorithms.

Examples

collapse all

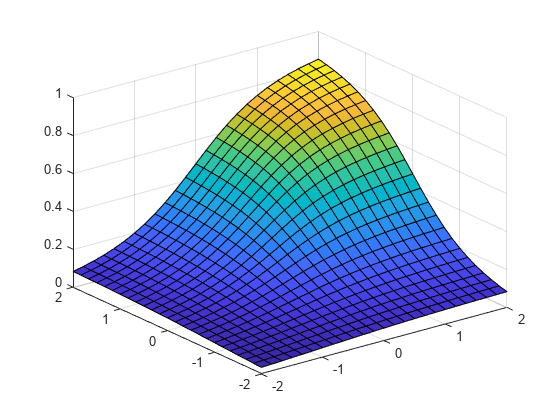
Compute the cdf of a multivariate t distribution with correlation the parameters C=[1 .4; .4 1] and 2 degrees of freedom.

C = [1 .4; .4 1];
df = 2;
[X1,X2] = meshgrid(linspace(-2,2,25)',linspace(-2,2,25)');
X = [X1(:) X2(:)];
p = mvtcdf(X,C,df);

Plot the cdf.

figure;
surf(X1,X2,reshape(p,25,25));

Figure contains an axes object. The axes object contains an object of type surface.

Input Arguments

collapse all

Evaluation points, specified as a 1-by-d numeric vector or an n-by-d numeric matrix, where d is the dimension of a single multivariate t distribution and n is a positive scalar integer. The rows of X correspond to observations (or points), and the columns correspond to variables (or coordinates).

Data Types: single | double

Correlation matrix, specified as a d-by-d symmetric, positive definite matrix, where d is the number of columns in X. If the diagonal elements of C are not all 1 (that is, if C is a covariance matrix rather than a correlation matrix), then the mvtcdf function rescales C to correlation form. The function does not rescale the evaluation points X.

Data Types: single | double

Degrees of freedom of the multivariate t distribution, specified as a positive scalar or a vector of positive scalars with length equal to the number of rows in X. If nu is a positive scalar, the mvtcdf function expands nu into a vector with the same number of rows as X.

Data Types: single | double

Rectangle lower limit, specified as a 1-by-d numeric vector.

Data Types: single | double

Rectangle upper limit, specified as a 1-by-d numeric vector.

Data Types: single | double

Numerical integration options, specified as a structure. Create the options structure by calling the statset function with any combination of the following parameters:

  • "TolFun" — Maximum absolute error tolerance. The default value is 1e-8 when d < 4, and 1e-4 when d ≥ 4, where d is the number of columns in X.

  • "MaxFunEvals" — Maximum number of integrand evaluations allowed when d ≥ 4. The default value is 1e7. The function ignores "MaxFunEvals" when d < 4, where d is the number of columns in X.

  • "Display" — Level of display output. The choices are "off" (the default), "iter", and "final". The function ignores "Display" when d < 4, where d is the number of columns in X.

Example: statset(TolFun=1e-7,Display="final")

Data Types: struct

Output Arguments

collapse all

cdf values, returned as an n-by-1 numeric vector, where n is the number of rows in X, or a numeric scalar representing the probability over the rectangular region specified by xl and xu.

Error estimate, returned as a positive numeric scalar. For bivariate and trivariate distributions, err is equal to the default absolute error tolerance (1e-8). For four or more dimensions, the mvtcdf function computes err as part of a quasi-Monte Carlo integration algorithm. For more information, see Algorithms.

More About

collapse all

Algorithms

For bivariate and trivariate distributions, the mvtcdf function uses adaptive quadrature on a transformation of the t density, based on methods developed by Genz [1]. The default absolute error tolerance for these cases is 1e-8. For four or more dimensions, the function uses a quasi-Monte Carlo integration algorithm based on methods developed by Genz and Bretz [2] [3]. The default absolute error tolerance for these cases is 1e-4.

References

[1] Genz, A. “Numerical Computation of Rectangular Bivariate and Trivariate Normal and t Probabilities.” Statistics and Computing. Vol. 14, No. 3, 2004, pp. 251–260.

[2] Genz, A., and F. Bretz. “Numerical Computation of Multivariate t Probabilities with Application to Power Calculation of Multiple Contrasts.” Journal of Statistical Computation and Simulation. Vol. 63, 1999, pp. 361–378.

[3] Genz, A., and F. Bretz. “Comparison of Methods for the Computation of Multivariate t Probabilities.” Journal of Computational and Graphical Statistics. Vol. 11, No. 4, 2002, pp. 950–971.

Version History

Introduced in R2006a