How can i create these two graphs in matlab , rough idea please
Mostrar comentarios más antiguos
Respuestas (1)
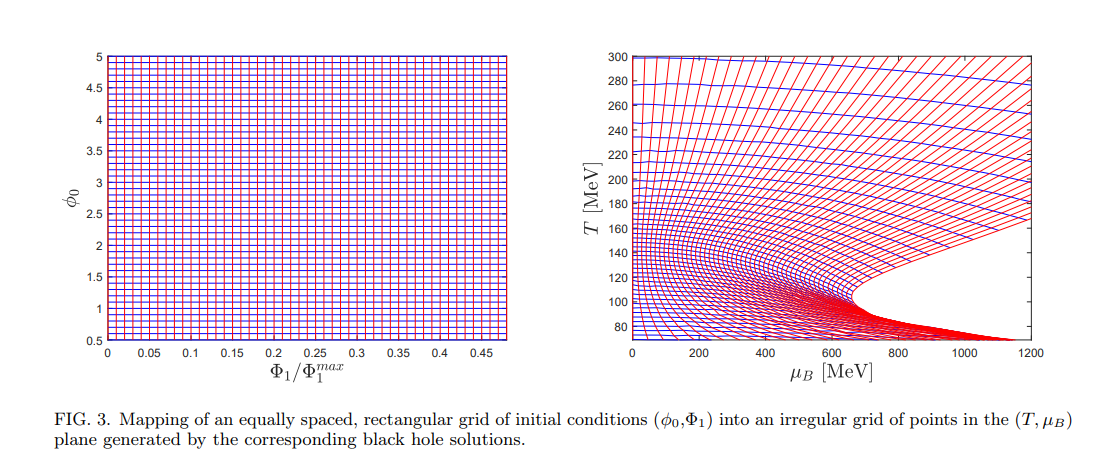
This is only half an answer, but you can reproduce the plot on the left using the following code:
% Define data
x = 0 : 0.01 : 0.48;
y = 0.5 : 0.1 : 5;
% Visualize the data
figure(1)
% Define axes limits
xlim([min(x) max(x)]), xticks(0:0.05:0.45)
ylim([min(y) max(y)]), yticks(0.5:0.5:5)
% Plot red vertical lines and blue horizontal lines
xline(x,'r')
hold on
yline(y,'b')
hold off
% Add labels to the axes
ylabel('\phi_0')
xlabel('{\bf\Phi}_1/{\bf\Phi}_1^{{\itmax}}')

Categorías
Más información sobre Annotations en Centro de ayuda y File Exchange.
el 22 de Feb. de 2024
el 24 de Feb. de 2024
Community Treasure Hunt
Find the treasures in MATLAB Central and discover how the community can help you!
Start Hunting!
Translated by ![]()