What inputs for pcolor
Mostrar comentarios más antiguos
Hi,
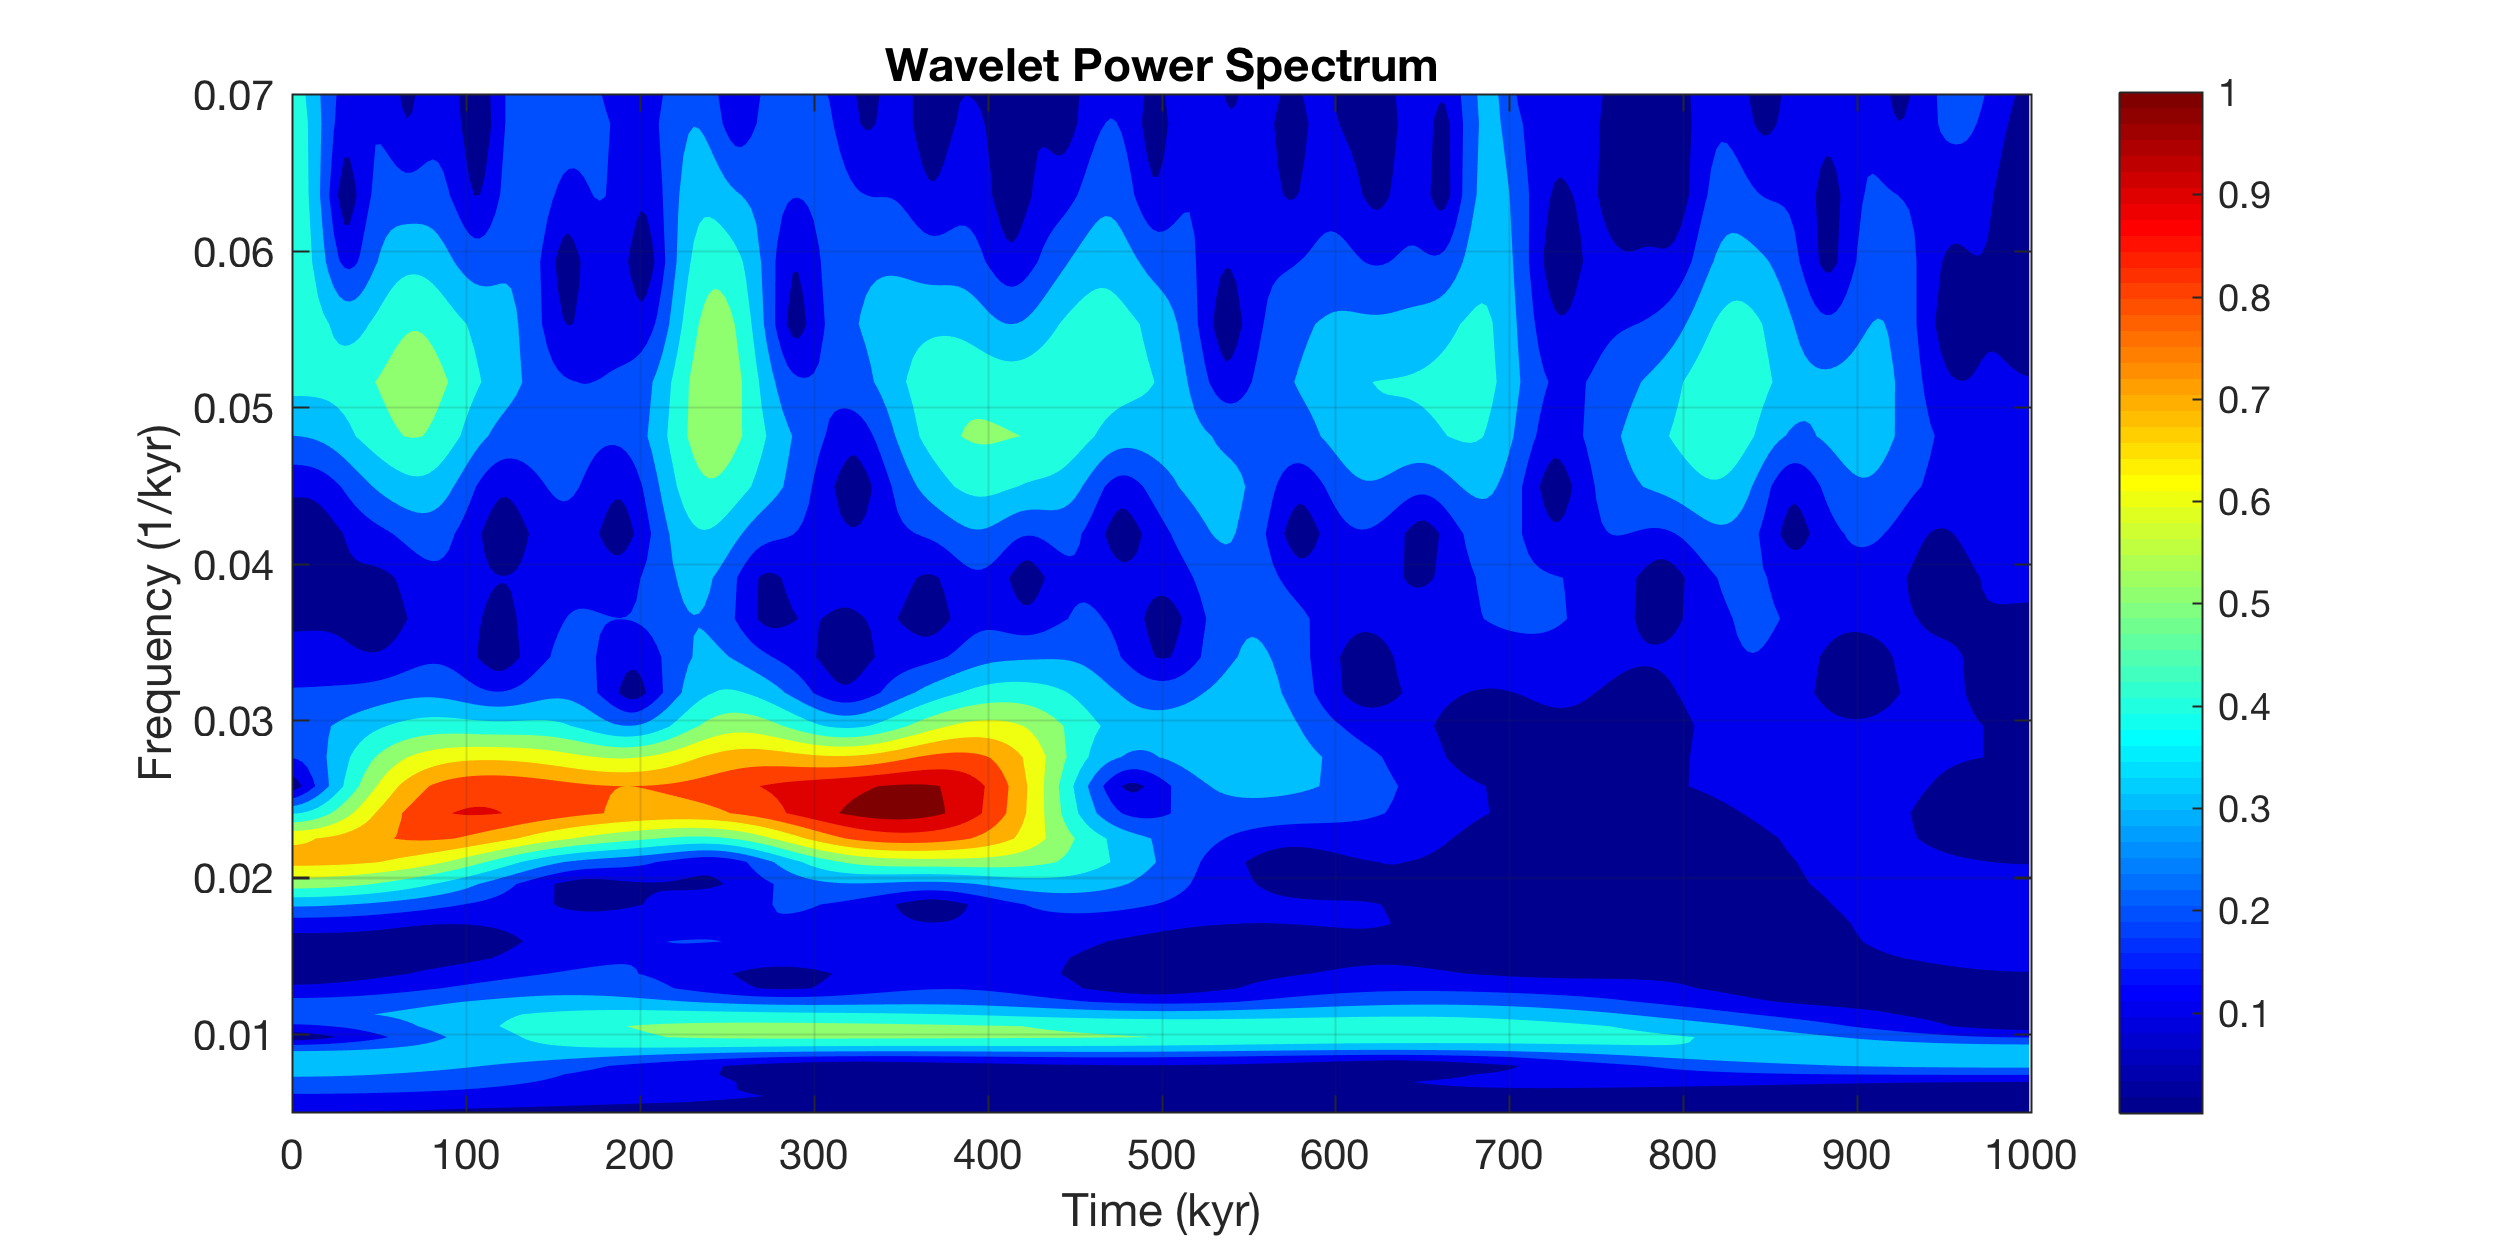
I am trying to generate a plot similar to this one:
I have a set of text files with two columns; Time in s and Velocity in m/s
I have a sampling freq of 20,000
I have generated a PSD using the code:
[Pxx, f] = pwelch(E,[],[],[],Fs);
where E is the all of the velocities and Fs is the sampling freq
How can I generate the above plot? What inputs should I put into the code:
pcolor(x,y,z)
Sizes:
E: 131072 1
f: 16385 1
Pxx: 16385 1
Sorry for the layout of the question, I dont understand enough to know how to ask the question eloquently
1 comentario
darova
el 3 de Mayo de 2019
What are your x,y,z? What do you want to plot? Can you attach your data?
Respuestas (0)
Categorías
Más información sobre Parametric Spectral Estimation en Centro de ayuda y File Exchange.
el 3 de Mayo de 2019
el 3 de Mayo de 2019
Community Treasure Hunt
Find the treasures in MATLAB Central and discover how the community can help you!
Start Hunting!
Translated by ![]()