Delivering the FRTB Internal Model: Main Benefits and Challenges
Luca Lamorte, Intesa Sanpaolo
The financial industry is preparing for the transition to the new regulation for market risk capital, Fundamental Review of the Trading Book (FRTB), upcoming in 2025. Luca Lamorte, an expert risk manager for Intesa SanPaolo, presents a brief summary of the main benefits and challenges that banks face in order to capitalize their trading desks according to the FRTB internal model approach (IMA). In particular, the validation tests at the individual desk level required by the FRTB are very challenging, which complicates the application of the IMA to the entire perimeter of the trading book. Luca analyzes these cases in detail, showing where MATLAB® can be of great use in performing analyses and benchmarking of the new legislation.
Published: 14 Nov 2022
Interesting to me, because in a previous life many years ago, I once tried to write trading algorithms that traded on reading real-time news from news wires and from market data providers. And so I guess I'm not completely unfamiliar with quite how difficult that is to get anything to make any sense.
So we've got time for a couple of questions. Someone asked-- I mean, you've got some timings for running queries here-- but how long does building the search tree take. And then can you run these searches concurrently? Or is this like a one-at-a-time time frame you're giving us?
OK, probably the answer to that depends on how you install it, if you do it locally, if you do it on a server on the cloud. You can do it concurrently. There's no doubt, even locally, you can do that.
Actually, it's super fast, right. This is one of the cool things about that. Even if you have 500,000 documents, the vector search, since they use what is called an approximate nearest neighbor algorithm, which is basically tuned, gives a bit of precision away, but therefore it's way faster. It's super fast.
And the BM25 implementation, this was actually of that database, the primary characteristic, right. This is really fine-tuned. So what you see is you get this within the ticker per second.
Yeah, yeah, OK. And so there are quite a few of these vector search databases out there. What caused you to go with OpenSearch rather than some of the others?
No, actually it's mostly-- first of all, it's got to be open source software because we are academics. We cannot license. Now, but actually Elasticsearch was sort of dominating this market for quite a long time. And that changed only over the last two years where a lot of startups now invented new databases, like Vespa, Weaviate, and several others.
I think all of them are super powerful. Some of them are particularly fine tuned for the vector search. But that has another disadvantage, and that disadvantage is that sometimes you need keyword search as well. So when you go through the list of all those providers, what is really important is that you find somebody that offers both services at the same time.
And that is a challenge because these approximate nearest neighbor algorithms typically work in a way that basically is a tree behind that, and that tree is fixed. So unless you change you redefine this index, right, you have problems changing that tree. And there are only few optimal that allow you that, but these are obviously quite interesting new fintechs, actually, that exist.
Yeah, great. OK, fine, fantastic. Thank you very much. That was absolutely fantastic. So thanks again, Ralph.
So I'm now pleased to welcome Luca Lamorte to the conference. Luca is risk manager in Market and Financial Risk Management at Intesa Sanpaolo. And he's going to be talking to us today about some of the interesting challenges and benefits that he's having delivering an FRTB model. So over to you, Luca.
Thanks, Stuart. Hi, everyone. I can try to clear the screen. OK, you can see.
It's thinking about it. And there it is. Yeah.
OK. Hi, everyone. Thanks so much for inviting us in the conference. I am Luca Lamorte. I work in Intesa Sanpaolo as risk management for internal model market risk officer. I have followed the FRTB Project for Intesa from 2016 until today, following the methodological and internal development paths. FRTB is the short name for the Fundamental Review of Trading Book. That will be the new rules for the market risk capital requirement starting from 2025.
Today, I present you a summary of Intesa's implementation for FRTB regulation. The main issues is that we are facing on to validate and maintain the internal model, also in the new rules FRTB.
Intesa Sanpaolo has developed FRTB from the beginning, and this year have implemented standardized approach and internal model measures. At the moment, we have a parallel running in production environment of FRTB measures from 2019. And we use MATLAB for the analysis of the measures and the aggregation benchmarking on the main figures.
In general, we have seen a benefit of internal model respect to the standardized approach when the old perimeter is at the IMA. Because in this case we have an increase of diversification effect between risk categories. That is, in standard approach is not considered.
Another benefit of internal model is the window for stress scenarios. Because if in the max simulation of expected shortfall, the scenario selected is concentrated on one or two risk categories, the other risk factors will be less relevant for the internal model capital charge.
This is not possible in standardization because the capital requirement is the sum of capital requirement for each risk category, based on conservative risk weights. In many cases, the transition for a single desk from IMA to standardized approach can imply a cliff effect in the total market remove making quarterly movements of capital less manageable and explainable to front office desk.
In this project, MATLAB was a very useful tool to build contingency solution for the single measure of FRTB. That we permitted to produce a regulation number before the delivery of target solution.
In the same time, we use MATLAB code to test and benchmarking respect to our target solution. For the internal model measure, we calculated the expected shortfall for each single desk, and then aggregated the results to obtain a capital charge. In the default risk charge measure, we implement the model of stochastic recovery rates, testing some possible impact in a different market situation. For the P&L profit and loss attribution test, we use MATLAB to have the statistic of the prescribed test, Kolmogov-Smirnoff and Spearman correlation, for each single desk to track the good quality of risk simulation respect to front office system.
In the last standardized approach, the new framework of standard is driven by the sensitivity-- delta, vega, and curvature-- of single instrument for each risk factor, and then use MATLAB to make the aggregation of the sensitivity to obtain the total capital charge.
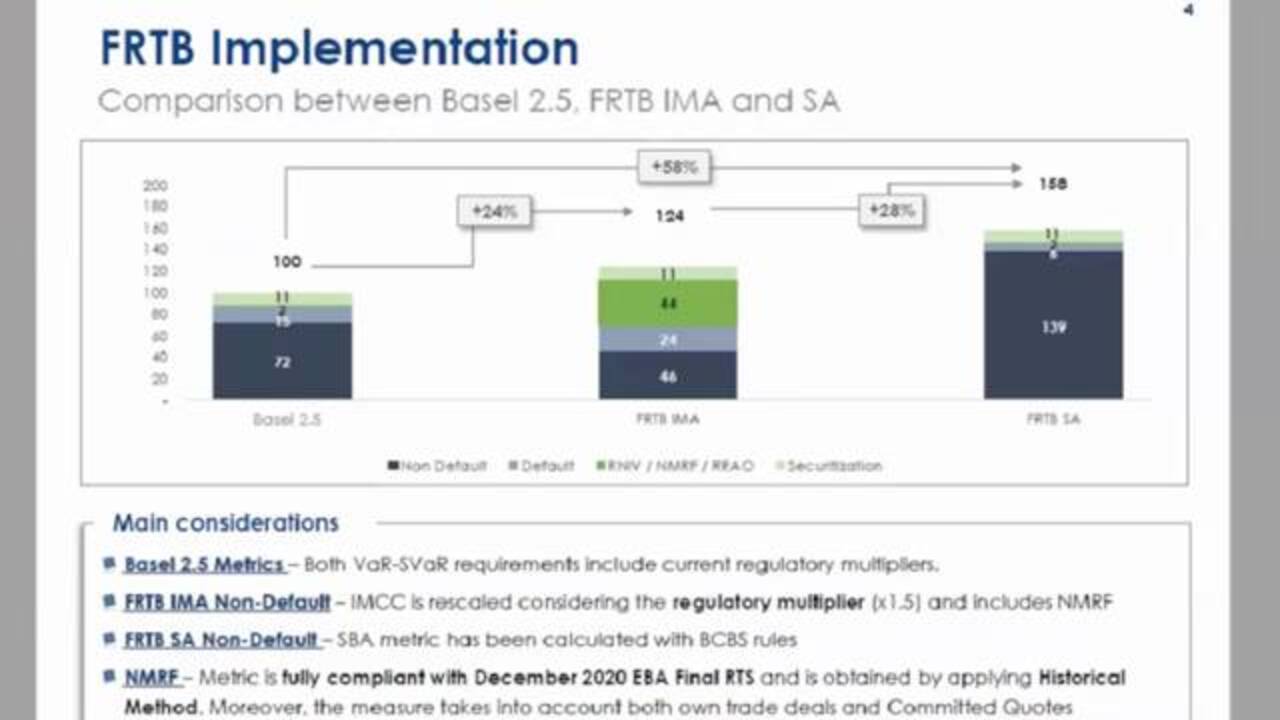
In this slide, we presented an example of removabe comparison between Basel 2.5-- it is a framework of market risk-- and FRTB under internal model and standardized approach. We can see that the FRTB may increase the capital respect to this situation for 24%. They would do in particular for the relevant growing risk not the model part. That are the stress of non-modellable risk factors. Respect to regulation, the stress calibrated for non-modellable are very impacting and conservative with respect to the real risk not present in the model.
The standardized approach are higher than the IMA for 28%, mainly for the not default part. Because in this part, we don't have a diversification effect between our risk asset class, like equity and credit spread, for example. In internal model, the revaluation of instrument on 10 days historical scenarios permit to have the simulation of all modellable risk factors in the same time, implying a diversification benefit for the measures.
Now we present the main interest of Sanpaolo concerns about the internal model under FRTB. The first is the new definition of the full measure-- not for the simulation model, that is similar to the actual framework-- but for the mandatory feature of the input. In particular, the principle point is the three basis point floor that could be increased again to respect the risk sensitivity about rating of issues.
The second one is the profit and loss attribution test for the validation of single desk IMA where we have experience not easily explain the results for some desk with low level of risk.
The last one is the before nominated stress of non-modellable risk factor. That also posed review of the last RTS, may maintain an IGA computational cost for a part of total requirement defined from the regulation as the residual part.
Starting from the default restructure, that is due to the current incremental risk charge where we have a similar simulation model, but with some important differences. Default restructure wants to measure only the default risk of the issuers in training portfolio. So the migration risk is excluded from the simulation.
Per second, the introduction of default risk also for equity position, cash and derivatives, where default, in this case, consist to drop to zero the equity underlying of the instrument. After that, the mandatory introduction of default probability and loss, given default, derived from credit risk for issuers in IRB perimeter. As said before, the model of default risk charge is very similar to the current IRC, Increment Risk Charge. Some features are more specified in FRTB, while before as dependent or modellistic choices of single bank-- for example, the stochastic simulation for recovery rate, the number of factors for the issuer's simulation, and the length of time span to calibrate the correlation across the issuers.
Lastly, it has been defined a minimum level for probability of default equal to three basis points for any issues in perimeter. These last point produces many discussion between the industry and the regulator, but remain a solid point of the IRC.
Passing to the specific cases of default risk charge, the most relevant is the definition of default probability floor, that being very conservative with respect to historical events. This monetary could be a driver for the bank to reduce the exposure of aggregating bonds in the portfolio, because these measures make very conservative with respect to the standard.
In particular, this event regards to the sovereign bonds where currently the probability of default is less three basis points, especially for triple and double A, like Germany, US, and France. While for ratings as a single A and BBB, three basis points could be not the last definition by regulators of floor. But to respect the risk sensitive, the regulator could impose a higher level for these issues that make the similar greater big enough.
In addition for the position in banking book, the credit risk measures for sovereign issuers don't have any charges. So the comparison between the two framework, market risk and credit risk, are very difficult to maintain.
The second issue is the introduction of equity position and default simulation. To achieve this, we have to implement a new pricing function that calculated the drop to zero of underlying for each type of derivative in portfolio. For complex equity payoff, like auto-callable and urola option, the pricing is computed through a Monte Carlo simulation, introducing a decomposite calculation for single component of index underlying increase, usually the computing time and simulation dimension. To obtain a reasonable simulation time, we have created a solution with proxy simulation based on grid with different level of index for in default.
The last point to discuss is the difference between internal model and standardized approach for default risk in FRTB. Because in the standardized approach, there are present risk with not very conservative expected to default probability impose in internal model. And with our parallel running, the standard default risk charge is less conservative with respect to the internal model.
The second issue is that I report today is the methodological problem of profit and loss attribution tests. This test in years had many reviews from regulators, but also in the final definition in the last eight years maintains some problems.
In particular, the most relevant is the penalization of a very common desk characteristic. We are talking about of the well-hedged desk, where the market risk is covered with instrument inside and same desk. In this case, we have as a result a little variance of desk, daily P&L, because the market movements are contained by the trader.
The test define an FRTB to prove the alignment between front configuration. In particular, the Spearman correlation penalized this kind of desk, because also little misalignments reduce highly the correlation between systems.
Another-- relevant theme is the massive input alignment necessary to pass the P&L attribution test. These parts are described in better way in the last RTS, but they remain a huge implementation cost for the bank.
Because the risk system have to simulate a lot of historical scenarios, so while front office systems have as target the daily P&L. So there are very different goals to reach to the system. For the well-hedged desk, we present a simple case where a single desk is composed of two strategies, that one is covered for the other.
As we can see in the left chart, when we test the two strategies separately, we obtain a correlation results more than 90%. While when we test the entire desk, the correlation decreases to 40%. This effect is very difficult to explain to the traders, because the main motivation of this desk for capitalizing with standardized approach is a problem of the statistical test of the regulation.
Another way, this effect could bring the banks to define a desk with more open risk to permit pass these tests and capitalize with internal model. As said before, capitalize this kind of desk with standardized approach is very pointed because all the internal hedge could be lost, caused by not considering diversification and affecting standardized approach.
The second part of profit and loss attribution problem is the alignment between risk and front office system. This argument can consider all the component of risk emulation environment, like perimeter of instrument, pricing functions, risk factor definition, and also the input values of risk factors.
In particular for this point to be able to respect the profit and loss attribution test, it's necessary to improve the connection between front office and risk system, because a different daily simulation of risk factors can produce a huge misalignment also on very simple instrument.
As a sample, we report a difference of fixing time of equity spot, align this kind of problem, getting the values from front office system permit to increase the Spearman correlation and pass the desk in green zone and capitalize with internal model. As a consequence, these new alignments produce a new process to implement for the risk system and the bank and controls and maintain in the target solution.
The last issues that we present regarding the stress of non-modellable risk factors. Also, this point was a review in the last RTS, reducing the number of simulation necessary, but maintain on heavy computational effort.
We report an example of this calculation executed on a set of interest rate risk factors. The direct meat, that's consisting of full evaluation of 250 historical scenarios. This simulation is very time-consuming and get the necessary a lot of memory to store results, because the simulation is for single bucket of risk factor.
The second method is the historical return that's based on the calibrated shock on historical series of risk factors, but reduce the number of simulation instruments from 250 to six. As a consequence, improve the performance without losing the significance of stress, because obtained results are very similar to the previous method.
The last two methods, the methods are necessary only in case of lack of information risk factor. It increase the value of stress requirement.
In our experience, the historical method is the most feasible, but maintain, again, a number of full evaluation necessary to obtain the non-modellable risk factor stress. This made necessary a new implementation to improve the performance of regulation, the evaluation framework for simulating all perimeter only on scenarios with few risk factors. So we multiply the simulation of each single risk factor, insert into non-modellable test.
This part remain a very punitive capital charge for the internal model, where this part and this framework is residual part of risk factor respect to the framework in Basel 2.5. And these kind of requirements could be reduced on decreases perimeter of non-modellable risk factor.
That imply the other cost for the bank to purchase data from external vendors to reduce the perimeter and then reduce the stress on that data set.
Our presentation is over. I can ask your question, if it's not.
Yeah, thanks Luca. That's great. So we have got a few questions. So you mentioned that some of these calculations are very time consuming, although.
[AUDIO OUT]
Featured Product
MATLAB
Up Next:


Related Videos:


Seleccione un país/idioma
Seleccione un país/idioma para obtener contenido traducido, si está disponible, y ver eventos y ofertas de productos y servicios locales. Según su ubicación geográfica, recomendamos que seleccione: United States.
También puede seleccionar uno de estos países/idiomas:
América
- América Latina (Español)
- Canada (English)
- United States (English)
Europa
- Belgium (English)
- Denmark (English)
- Deutschland (Deutsch)
- España (Español)
- Finland (English)
- France (Français)
- Ireland (English)
- Italia (Italiano)
- Luxembourg (English)
- Netherlands (English)
- Norway (English)
- Österreich (Deutsch)
- Portugal (English)
- Sweden (English)
- Switzerland
- United Kingdom (English)