Design SEPIC Controller for Robustness - MATLAB & Simulink
Video Player is loading.
Current Time 0:00
Duration 11:46
Loaded: 1.40%
Stream Type LIVE
Remaining Time 11:46
 
1x
  • Chapters
  • descriptions off, selected
  • captions off, selected
  • en (Main), selected
    Video length is 11:46

    Design SEPIC Controller for Robustness

    From the series: How to Develop DC-DC Converter Control in Simulink

    Learn how to design a digital controller for a SEPIC (single-ended primary-inductor converter) that satisfies design requirements while being robust to variations in passive component values. See how to use sensitivity analysis to identify passive components of the SEPIC circuit that have the highest impact on controller performance. Learn how to use optimization techniques to tune controller gains so that the design meets requirements even as passive component values vary.

    Published: 10 Jan 2024

    In this video, we'll see a workflow for designing a digital controller for a DC-DC converter that satisfies design requirements while being robust to variations in passive component values. More specifically, we look at how to tune our controller for a SEPIC circuit such that it meets the voltage step response requirements even when the passive component values of the circuit vary outside the nominal values.

    The workflow we'll follow to get there is we'll use sensitivity analysis to identify passive components of the SEPIC converter that have the highest impact on voltage requirements being satisfied. We'll then use response optimization to tune the controller values while accounting for variations in the identified influential parameters, thereby streamlining the optimization process and minimizing the number of required evaluations. And we'll conclude with the secondary sensitivity analysis to evaluate if the controller is robust to all possible combination of parameter values and not just on the influential ones, thereby gaining more confidence with the controller.

    Let's take a look at a demo. In this demo, we use a model of a single-ended primary inductor converter, abbreviated as SEPIC, to control a string of LEDs. This is a type of a DC-DC converter similar to buck-boost converter. The output voltage of the converter is controlled by the duty cycle of the control switch. And in this case, it is controlled such that the voltage at the output is higher than the supplied voltage.

    The design requirement for the controller for this circuit corresponds to achieving a final voltage of 18 volts, while the supplied voltage is 12 volts, along with meeting other step response requirements of rise time, settling time, percent overshoot, and final settling percentage. All of these requirements are captured and indicated by the solid black lines in the Check Step Response Characteristics block.

    In this case, we already have an initial PI controller that was tuned for the nominal values of the circuit components. Let's run the simulation with the nominal values. We see that the SEPIC circuit response with these controller gains satisfies the voltage step response requirements.

    Now, when looking back at the SEPIC circuit, there are seven circuit components, three capacitors, two inductors, and two resistors. And based on the data sheet, we know the nominal values for each component. But we also know there is a manufacturing tolerance. So the component values could be anywhere in the range between minimum and maximum values specified.

    One question that would come up now is, is our controller robust to variations in these component values. To analyze if a controller is robust to these variations, we can use sensitivity analysis. Let's now set up a model for sensitivity analysis.

    To do so, we open the Sensitivity Analyzer app, which is available as part of the Simulink Design Optimization product. In the app, we click on Select Parameters and select the Variables of Interest. In this case, the variables are all the circuit components that can vary. In addition to these components, we also add the Load Resistance, which we vary between 50 to 350 ohms.

    Next, we specify how to generate values for these parameters. For this, we click on Generate Random Values, set the Number of Samples to 100, specify the preferred Sampling Method, and then specify the Lower and Upper bounds for each component as specified in the datasheet. Additionally, you can also specify the probability of occurrence of component values within their range by selecting the appropriate type of Distribution from an array of options. Clicking OK will now generate the sample values.

    Finally, we'll specify the design requirement. That is the requirement against which a controller will be evaluated for all the generated sample values. Here, we'll select Step Response Envelope requirement and enter the desired Step Response characteristics that we saw earlier.

    Now, to associate the signal from our Simulink model to this requirement, we'll click on the Plus icon and click on the output of the SEPIC converter circuit. The signal, which represents the output voltage of the circuit, is now associated with this requirement. And we are ready to evaluate our controller.

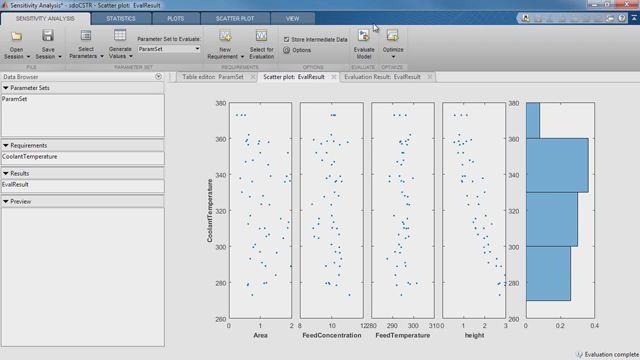
    On evaluating the model, we see that majority of the parameter values tested satisfy the requirements. This is indicated by a zero or a negative value of the Step Response envelope. However, there are some sets of parameter values tested which do not satisfy the requirements. These are indicated by a positive value. This indicates that a controller should be tuned further to account for these parameter variations.

    The question now would be how to tune a controller to account for these variations. This is where response optimization comes in. Now, there are a couple of approaches you can take to tune your controller. You can either perform a full optimization by considering all eight uncertain variables, which would take a considerable amount of time and model evaluations, or identify the parameters that have the highest impact on the voltage requirements being satisfied and then consider those as uncertain variables during optimization.

    We'll pick the second approach. To identify the influential parameters, back in the Sensitivity Analyzer app, select the Statistics tab, select Correlation and Standardized Regression for Methods and Linear and Ranked for Types. And then click on Compute Statistics. A tornado plot shows up.

    We can see that the output capacitor C4C5 is the most influential, followed by the Load Resistor. This follows our intuition as well. Since the output capacitor maintains the voltage for the load, it is expected to be the most influential component. With Sensitivity analysis, we not only evaluated our controller for robustness but identified the most influential parameters to consider for optimization.

    Now, let's jump into Optimization for tuning the controller values. To do so, we can click on Optimize and Create Response Optimization Session in the Sensitivity Analyzer app. This would initiate a handoff to the Response Optimizer app where you can select requirements and parameters to be imported directly into the session. For this case, let's select the Step Response Envelope to be imported and click OK to create a Response Optimizer Session.

    Next, we add the Design Variables to tune by clicking on the dropdown next to the Design Variable Set and selecting New. Here, let's select the PI gains Kp and Ki as our design variables. We'll follow similar steps to create the Uncertain Variables set.

    In the Create Uncertain Variables Set dialog, only select the capacitor C4C5 and the Load Resistor as Uncertain Variables as these were the most influential parameters. And define the Maximum and Minimum values for these parameters. Then, select Minimum and Maximum combinations only as the Sampling method. With this selection, the tool will simulate the model with minimum and maximum combinations of these two parameters in addition to the nominal values during the Optimization process.

    The next step is to select the Optimization method. Here, we will select Pattern Search as our Optimization solver, considering that our problem is non smooth. But as you can see, there are other Optimization methods available as well, which you can select depending on the problem you are solving. With the Step Response Requirement already loaded, we can now optimize the Controller gains while considering Uncertain Variables.

    We can see that the Optimization algorithm converts to values of Kp and Ki, which satisfy requirements when considering all combinations of Minimum and Maximum values for the two parameters identified to be the most influential.

    In this demo, we used Optimization to tune controller values. But by using the same approach, you can use Response Optimization to optimize any plant parameters, such as circuit components or jointly optimized controller and plant parameters to achieve a certain objective. Now that we have our tuned Kp and Ki values, we can perform another Sensitivity Analysis to determine if these gain values are robust to all the parameter value uncertainties and not just to the two influential parameters that were considered.

    To do so, we'll reopen the Sensitivity Analyzer session, select Generate Values dropdown, and click on Generate Gridded Values. Here, in addition to the 100 random points tested previously, we can include every combination of Minimum and Maximum values for all eight parameters. Click on Append to add these combinations to the set.

    Now, on evaluating the model, we see that all the parameter values tested satisfy the requirements. This is indicated by a zero or negative value of the Step Response Envelope, that is, the controller tuned with Kp and Ki values is now robust to component variations within the range of their tolerances.

    To summarize, we used Sensitivity Analysis to identify the circuit components that have the highest impact on the voltage requirements, we then used only the identified influential parameters as uncertain variables while optimizing the gains of the controller, and finally evaluated the robustness of the controller to all the parameter value uncertainties by running a secondary Sensitivity Analysis.

    While we could have considered using Response Optimization and specified all seven passive component values and the load resistor as uncertain variables, that approach would have taken way more model evaluations than the method showcased, and hence would have taken longer time to optimize the gains of the controller.

    Now, having built confidence on this controller with the method showcased, we can now automatically generate C code to run this controller on our target hardware. To learn more about the complete workflow for modeling and simulating a DC-DC converter in Simulink, generating C code for the controller, and performing hardware-in-the-loop testing, please refer to the linked video series.